Closing Comments
Lynn Miller
December 10th, 2015
Corn:
Better than expected export sales: 1.10 mmt. This was the jump start to the day that kept corn above support. When we failed to fall it may have very well spurred some short-covering.
Funds are thought to have coverd 10-12,000 shorts today.
The rally today pushed US bids to China $0.10-$0.15/bu over Brazil, with a stronger dollar not helping us. Brazil is on the verge of being downgraded to junk status by Moodys, this will push the Real even farther away from the dollar.
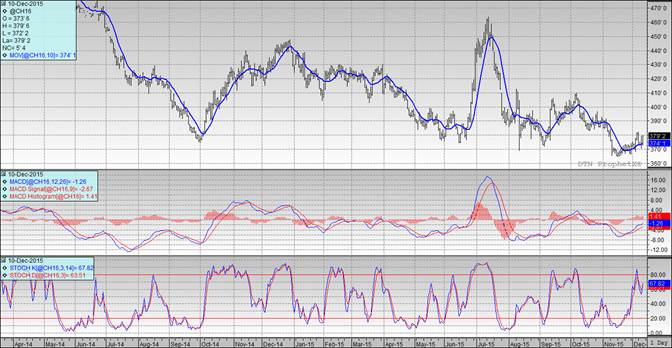
Technically, once again, all three indicators are bullish the March futures. Nearby support has moved up to $3.75. The stochastics have turned to buy mode; however, we are at the top-end of neutral territory. My selling targets remain at $3.80, $3.85 at the 50-day moving average level, followed by $3.94 and $4.10 should we be able to regain positive momentum.

Soybeans:
Again, strong export sales where all the jazz today coming in at 1.45 mmt and above expectation. Shipments are catching up, now at 21.2 mmt vs. 22.7 last year. Other than exports we are basically holding out breathe waiting for Argentina to announce their new Ag Policy and export taxes.
Some of the rain deficits are starting to take their toll. Malaysia dropped palm oil production 400 tmt from October to November, the biggest drop in the past 15 years.
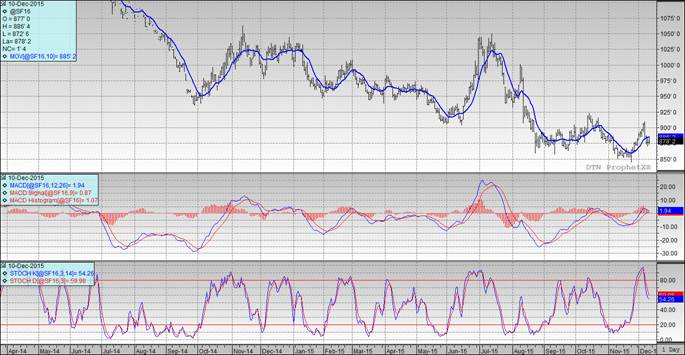
Technically, two of three indicators remain bearish the March futures. The stochastics are in full sell mode; however, we did manage to touch the 10-day moving average today. The MACD is our sole remaining positive and it is trying to come together. Nearby support has moved up to $8.75. Assuming you have made sales on the way up, I would be looking for $9.30 as my next target (this would be the 200-day moving average). If you missed this rally I would be looking to make catch up sales at $8.85, $8.94, $9.04 and $9.23.

Wheat:
Short covering led the rally in wheat today, which is becoming quite common place. Exports were lower than expected at 225 tmt, only ½ of last year’s volume. Black sea wheat priced into Egypt today. Warm temps in Russia and the Ukraine are keeping winter kill fears at bay.
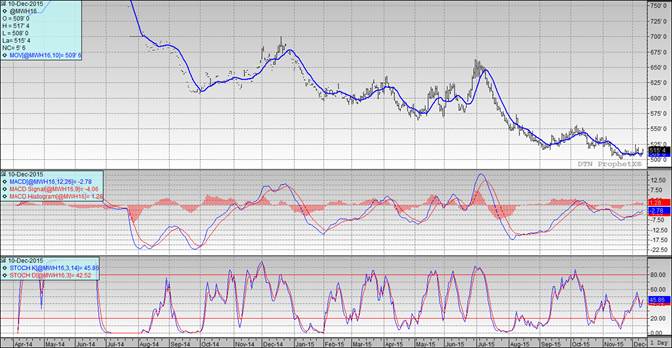
Technically, all three indicators have turned bullish the March Minneapolis futures. The low end of the trading range was on the 10-day moving average and we only traded up from there. Today’s price action may have moved nearby support up to $5.13. I am still serious about pricing some wheat at $5.25 futures, this is the 50-day moving average and 33% retracement. If you need to make some catch-up sales I’d try to get bushels on at $5.21.

Top Trending Reads:


