Closing Comments
Lynn Miller
January 12th, 2016
Hip Hip Horray for the USDA… Well not really, but at least they gave us something to trade. Or if you want to be realistic, they gave the funds a reason to reverse some of the ginormous short positions they hold. I wouldn’t call this a bullish report, but for the first time in a long time, I would call it producer friendly. Even though the majority of the wheat numbers were bearish, the trade was so super short we saw good gains in all wheat markets.
Corn:
From the report:
Yield: 168.4 vs. USDA’s 169.3 in November and the trades guess of 169.2
Production: 13.601 vs. USDA’s 13.654 in December and the trades 13.646
Ending Stocks: 11.212 vs. USDA’s 11.731 in September and the trades 11.237
US Carryout: 1.802 bbu vs. USDA’s 1.785 in November and the trades 1.785
World Carryout: 208.9 MMT vs USDA’s 211.85 in December and the trades 212.51
As you can see the bulk of the numbers were producers friendly; however, the US Carryout was increased 17 million bushels. Not sure the market wasn’t forgetting the whole picture in the wake of the report today. The one thing is US Carryout was not increased as much as exports were decreased (50 million bushels).
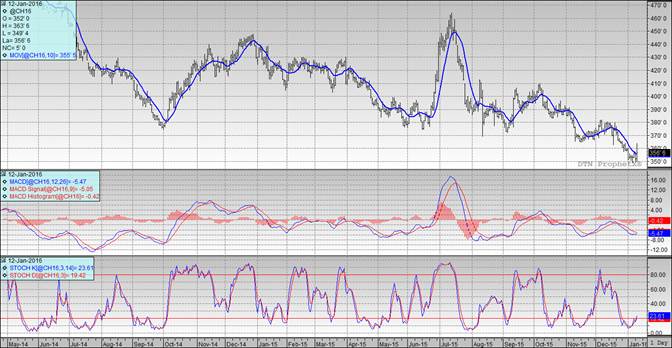
Technically, two of the three indicators have turned bullish the March futures today. We closed above the moving average with the stochastics in buy mode with the MACD finally coming together. Nearby support continues to hold at $3.48; however, we did close at $3.56 which is exactly the resistance level. Should this hold tomorrow we would move support up. My selling targets would be $3.62, $3.66, $3.70, $3.75, $3.82 followed by $3.92.

Soybeans:
From the report:
Yield: 48.0 vs. USDA’s 48.3 in November and the trades guess of 48.3
Production: 3.930 vs. USDA’s 3.981 in December and the trades 3.981
Ending Stocks: 2.715 vs. USDA’s 3.191 in September and the trades 2.720
US Carryout: 0.440 bbu vs. USDA’s 0.465 in November and the trades 0.468
World Carryout: 79.3 MMT vs USDA’s 82.86 in December and the trades 82.57
The reduced yield and production were probably the biggest surprises today. Then to me the reduction in world carry out sets us up for more momentum should any type of weather scare come to fruition.
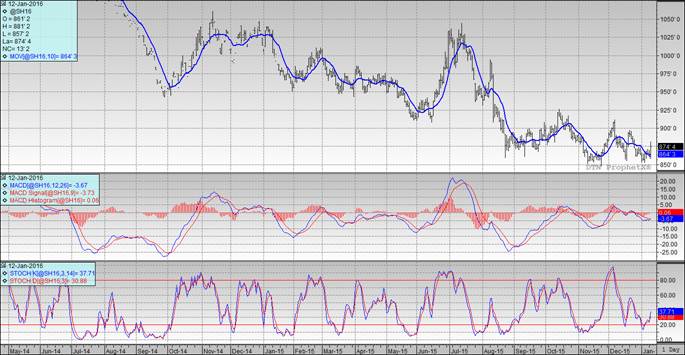
Technically, all three indicators have crossed over into bullish territory for the March futures. We closed significantly over the moving average with the stochastics in buy mode and the MACD finally signally. Now we wait for this market to tell us to sell. Nearby support has moved up to $8.66 and closed just under the next level of resistance at $8.75. My selling targets would be $8.75, $8.82, $8.90, $9.00 then $9.12 if you really want to reach.

Wheat:
The importance of this report is different for wheat. Yes, they give us US and World ending stocks, but more importantly this is the first show of what was actually planted for Winter Wheats.
From the report:
Ending Stocks: 1.738 vs. USDA’s 2.089 in September and the trades 1.698
US Carryout: 0.941 bbu vs. USDA’s 0.911 in November and the trades 0.919
World Carryout: 232.0 MMT vs USDA’s 229.86 in December and the trades 229.60
From a supply stand point with wheat, everything was bearish today, US stocks are growing and so are the wheat stocks around the world. But what helped to drive price up today….
Planted Acres:
All Winter Wheats: 36.6 Million acres (Estimate was 39.2)
HRW: 26.5 million acres (Estimate was 28.8)
SRW: 6.72 million acres (Estimate was 7.14)
This is nearly a 3 million acre reduction in the US alone. This will not fix the over-abundance of wheat in the world, but it will help us focus on our own production and hopefully help to draw our stocks down year-for-year.
Don’t lose track of the big picture here though, demand is still poor US and World stocks are rising. Take this break as an opportunity to price bushels and don’t expect a long run upward. (Of course, this line of thinking is subject to change should we get a good weather problem)
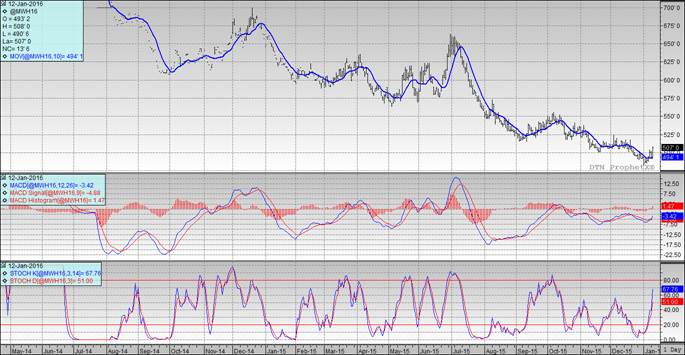
Technically, all three indicators remain strongly bullish the Minneapolis March futures. The stochastics are soaring into over-bought territory, so we may want to keep an eye out so we don’t miss this opportunity. Nearby support still sits at $4.82. My price targets now would be $5.10, $5.20, $5.28 and $5.39.

Top Trending Reads:
Topics: Grain Markets
- A Visual History of Google Algorithm Changes [Infographic]
- Can a Career in B2B Marketing Be Fulfilling? [SlideShare]
- A Sampling of the Sexiest Business Blogs on the Internet


