Craig’s Closing Grain Market Comments
January 07, 2015
I ran across this quote and wanted to share it with you. Probably good advice as we look at marketing grain in 2015, there will be opportunities but they may be short lived. Don’t let them pass you by.
“[Successful investing requires] this crazy combination of gumption and patience, and then being ready to pounce when the opportunity presents itself, because in this world opportunities just don’t last very long.” – Charlie Munger
Corn:
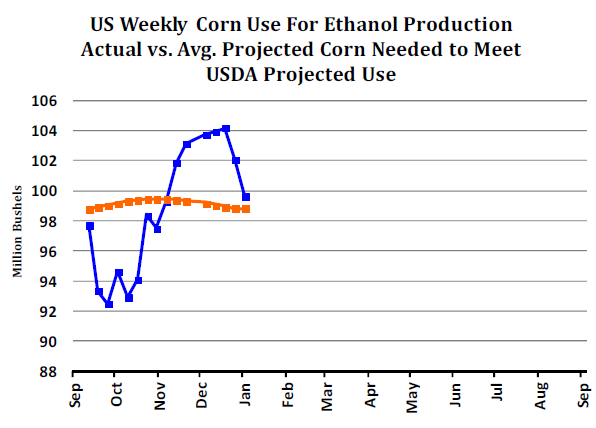
The only real news that I saw hit the market today was the weekly ethanol production report and its release corresponded with about a $0.04/bu drop in the futures market. After six weeks of grinding over 100 million bushels a week for ethanol production we saw the weekly grind drop to 99.645 million bushels and that decrease brought with it additional fears that the plummeting crude oil prices could have a significant impact of ethanol demand as well. As you can see on the following chart the weekly numbers, as represented by the blue line, have fallen the past couple of weeks and although it is still above the levels needed to achieve the USDA annual production (orange line) it is concerning never-the-less.

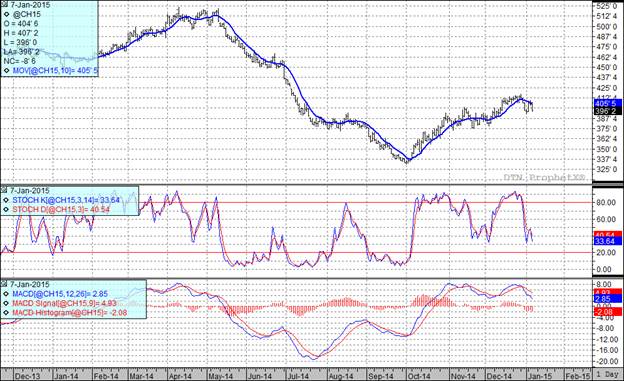
All three of my technical indicators are back in the bearish camp. At the end of the day we are still trading in a sideways range. If we look at the Fibonacci retracement numbers we see support in the March futures at $3.84 with more significant support at $3.64. On the up side the $4.17 area looks formidable and of course the gap looms at $4.26.

Soybean:
We had soybean oil trading higher today on renewed fears that the torrential rains in Malaysia have damaged the palm oil crop. We also continue to see the trade concerned over potential weather problems in South America and that was supportive today as well. We are not too far away from the South American crop hitting the export market and when it does look for our export business to dry up. With all of the concern over potential damage to the crop I thought it would be interesting to compile a list of what the various agencies and consultants are pegging the crop size at. The breakdown is as follows:
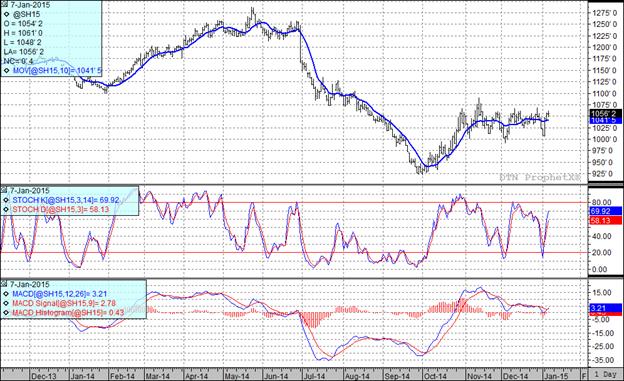
With today’s close all three of my indicators are bullish once again. Yesterday I wrote that I thought the top of this market was probably in the $10.60 to $10.70 range basis the March futures. Today the high was $10.61 and I continue to believe selling in that neighborhood will probably make you look like a genius when this is all said and done.
I would also suggest that $10.45 basis the November futures might not be a bad place to make some new crop sales if we get the opportunity.

Wheat:
In kind of a classic case of live by the sword, die by the sword we saw wheat trade lower today with the release of an updated forecast which showed a very small area of the winter wheat subject to damage from this week’s frigid temperatures. If the report is to be believed the damage seems isolated to parts of Nebraska and Kansas. This was enough to get the funds selling and away we went.
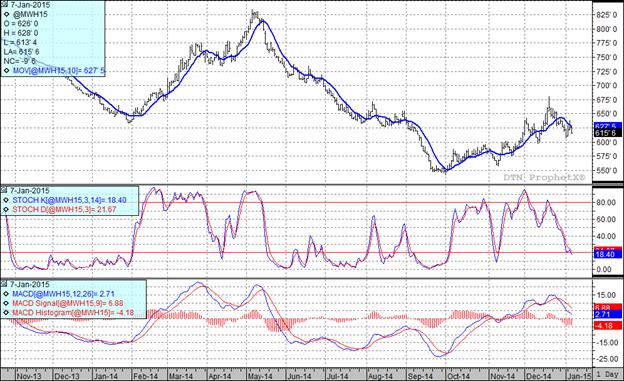
As I mentioned above, no one is too concerned about winter kill as we beat the wheat market like a rented mule today. All three of my indicators are currently bearish and things feel soft and yet I can’t get over the felling that we may be a little oversold at the current time. If we do get a bounce it needs to be sold.

Top Trending Reads:
- Grain Outlook for 2015
- How To Determine If Commodity Prices Are Too Low To Market Grain
- Using Futures Options In Grain Marketing
- Market Insider from the Farm and Ranch Guide
This data and these comments are provided for information purposes only and are not intended to be used for specific trading strategies. Commodity trading is risky and North Central Farmers Elevator and their affiliates assume no liability for the use of any information contained herein. Although all information is believed to be reliable, we cannot guarantee its accuracy and completeness. Past financial results are not necessarily indicative of future performance. Any examples given are strictly hypothetical and no representation is being made that any person will or is likely to achieve profits or losses similar to those examples.
North Central Farmers Elevator - 12 5th Ave. Ipswich, SD - 605-426-6021.


