Craig’s Closing Comments
March 31, 2015
Corn:
Today’s report left me more confused than a chameleon in a bag of skittles. I, like the rest of the trade, was fully expecting a smaller planted acres number than what we received. I also hadn’t really given any thought to the quarterly stocks number and certainly didn’t expect that to provide a bearish surprise.
Let’s start with the stocks number. Heading into this report the average trade estimate was that we would be shown a March 1 corn stocks of 7.609 billion bushels. Instead the trade got hit with a sucker punch when the USDA put the stocks on March 1 at 7.745 billion bushels. Of that number on farm storage accounts 4.38 billion of those bushels which the trade is interpreting to mean that the USA farmer has more corn to sell than expected. The bottom line is that we have one of the four largest March 1st carry-outs since 1985 and that reality helped pressure corn lower during today’s session.
Planted acres caught the trade flat footed as well. Heading into the report the average trade guess was 88.731 and today’s report gave us a planted acre number of 89.199 million acres. That was enough to send the trade into a frenzy as they gave the corn market a beating that was reminiscent of a good old fashioned Saudi Arabian lashing. The question then becomes, “Was this reaction justified?” I don’t know if I know the answer to that but here is my best guess as to how the math will work out. The following chart takes today’s planted acres number and then takes that number times the normal % harvested to arrive at a harvested acres number. I then took the ending stocks number from the March 10 report and plugged in the demand numbers that the USDA used at the Farm Forum. Finally I ran three scenarios. The first uses the national average yield used at the Farm Forum, the second uses last year’s national average yield while the 3rd scenario uses the national average yield from 2013/14 and the 4th uses the 2012/13 national average yield. It is interesting to note that using the Farm Forum numbers we would see a small decrease in ending stocks from this year to next while duplicating last year’s yield would push stocks to near two billion while a yield like two years ago would plunge the ending stocks to less than a billion bushels and a yield such as we had in 2012/13 would blow the prices sky high as we rationed to keep from running out of corn. What I think this tells me is that in spite of today’s reaction, any hint of production problems will have the ability to move this market dramatically higher.
Speaking of potential production problems we continue to see slow USA corn planting corn planting with only 20% of the acres in Texas planted versus 43% on average. As we reported yesterday, Louisiana is 16% planted versus 81% on average. Nobody is going to get too concerned about slow planting in the Delta but is this trend continues we will see some bullish excitement
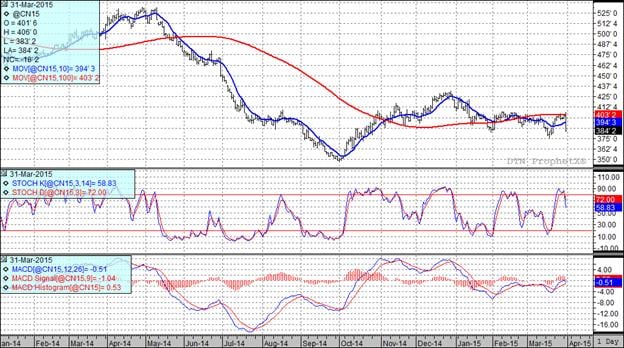
Today’s action was tough on the charts as all three of my technical indicators are now bearish both the old and new crop futures.

Soybean:
Beans closed higher on the heels of the report but it is really hard to find much that is bullish coming out of this report.
The March 1st stocks were pegged at 1.334 billion bushels which was slightly less than the average trade guess of 1.346 billion bushels. As indicated in the following graph stocks have rebounded nicely over the levels seen the past couple of years and that is usually not a bullish story.
The other piece of the puzzle today was the planted acres report. Heading into the report the average trade guess is that we will be given a planted acres number of 85.919 million acres to play with so today’s actual number of 84.615 million acres had traders buying. The following table uses the same frame work that I applied to the corn market up above. You will note that we could see beans get real tight but given the current scenarios as well as the fact we are harvesting a record crop in South America it becomes much tougher to paint a bullish picture in beans than it does in corn.
Speaking of South America I see that the Brazilian bean harvest is around 70% complete, but they’ve only sold an estimated 53% of the crop. Last year they had sold 63% by this time and it was a smaller crop. With a lot more beans yet to come to town down there it may keep a damper on this market.
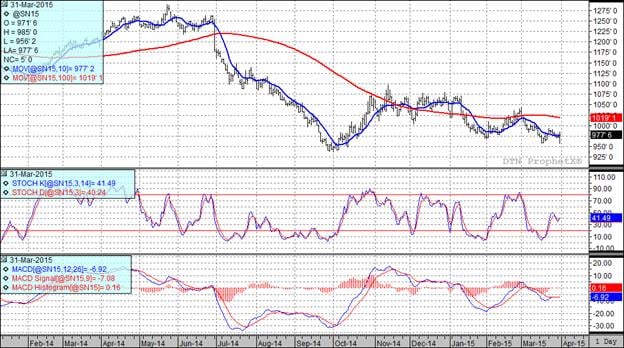
At the present time all three of my technical indicators are bullish the old crop while two of three are bullish new crop futures.

Wheat:
We had limited news in the wheat market today. Today’s report had the March 1st stocks posted at 1.124 billion bushels, just slightly less than the average trade guess of 1.14 billion bushels.
The trade was looking for an all wheat planted acres of 55.796 million acres so today’s report pegging planted acres at 55.376 million was slightly disappointing but obviously not enough to offset the selling that entered this market today. At the end of the day this seems like a neutral report and I suspect that in the coming days traders may look back on this and rue not buying the break.
At the present time two of my three technical indicators are bearish both the Kansas City and Minneapolis July futures. Yesterday I wrote, “We should get some follow through to the upside but in this market I would not be surprised to see the market to retreat and fill the gaps at some point.” With today’s price action we have now filled those gaps.
Top Trending Reads:
- Grain Outlook for 2015
- How To Determine If Commodity Prices Are Too Low To Market Grain
- Using Futures Options In Grain Marketing
- Market Insider from the Farm and Ranch Guide
This data and these comments are provided for information purposes only and are not intended to be used for specific trading strategies. Commodity trading is risky and North Central Farmers Elevator and their affiliates assume no liability for the use of any information contained herein. Although all information is believed to be reliable, we cannot guarantee its accuracy and completeness. Past financial results are not necessarily indicative of future performance. Any examples given are strictly hypothetical and no representation is being made that any person will or is likely to achieve profits or losses similar to those examples.
North Central Farmers Elevator - 12 5th Ave. Ipswich, SD - 605-426-6021.


