Craig’s Closing Comments
April 9, 2015
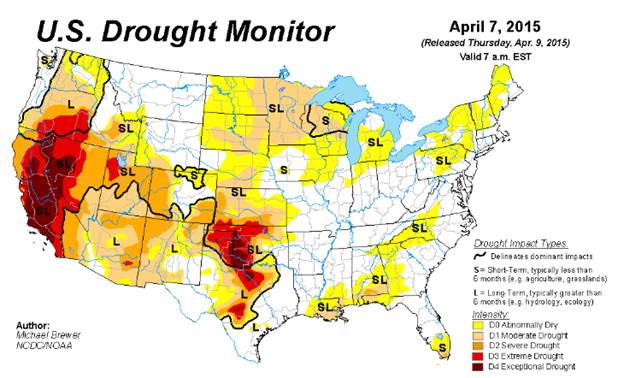
With the April USDA report now behind us I am guessing we will soon be back to trading domestic weather and once that happens I would be willing to bet my first born son that we will hear a lot of drought talk. The latest drought monitor map was released today and would seem to offer some reason for concern.
Corn:
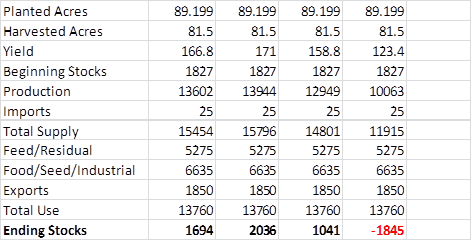
The April USDA report arrived basically where the trade expected it to be. The USDA bumped up the projected 2014/15 carry-out by 50 million bushels to a total of 1.827 billion bushels based on reduced feed demand. I can’t resist playing games with the numbers so the following chart uses the projected planted acres from the March 31st report, today carry-out number and the demand numbers from the USDA Farm Forum. I then plugged in different scenarios for the national average yield this year, starting with the 166.8 bu/acre that was used at the Farm Forum and then using the national average yield for each of the past three years for the other scenarios. I am not going to insult your intelligence by exploring the price action that each of these ending stocks would generate but I do think it illustrates how volatile this summer could be if we experience any significant production problems.
If there was a surprise in today’s report it was in the projected world carry-out for 2014/15. The March report gave us a projected number of 185.28 MMT and coming into today’s report the trade was looking for some growth in the carry-out with the average trade guess sitting at 186.91. With that as the backdrop they were surprised by the new projected carry-over number which now stands at 188.5 MMT. This is a 3.22 MMT increase over last month and had a dampening effect on prices during today’s session.
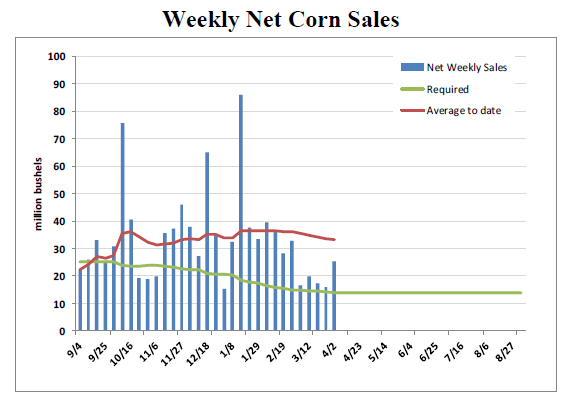
In other news we did have the weekly export sales report out this morning which was very good. In fact at 25.2 million bushels it was above the top end of the range of trade estimates. As you can see on the following chart, it was the best week we have had in the past month or so. All in all the export pace continues at a very good clip.
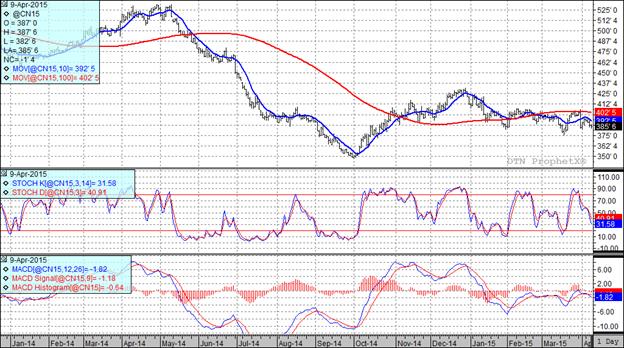
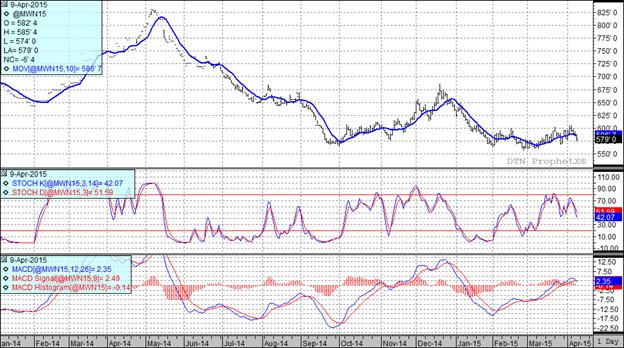
All three of my technical indicators are currently bearish for both the old and new crop futures.
Soybean:
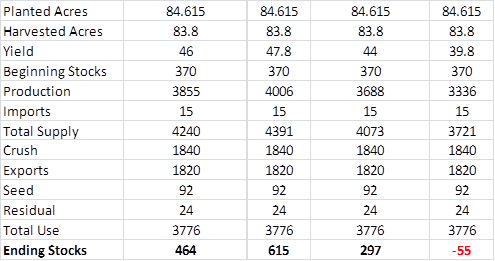
Beans came in almost exactly in line with trade estimates. The trade was looking for and ending stocks number of 370 million bushels and that is exactly what the USDA gave us today. They arrived at that point by increasing beans used for seed by 6 million bushels while also bumping up residual use by 14 million. On the other side of the equation they increased soybean imports by 5 million to have a net reduction in the bean carry-out of 15 million bushels. The world carry-out held no surprises either as the trade was looking for a number of 89.53 MMT and they were presented with an 89.55 MMT projected world carry-out. As a point of reference in March the world carry-out was projected to be 89.53 MMT while last year it was 66.32 MMT. If we play the same numbers game that we played with corn we generate the following table which would seem to illustrate that beans should have a harder time mounting a sustained rally this year than corn will.
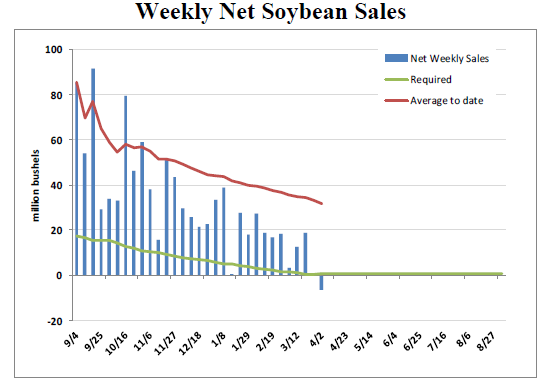
While the USDA report was pretty much in line with expectations the weekly export sales report was very disappointing as we registered a negative number, i.e. net cancellations for the week of 6.49 million bushels. As you can see on the following chart we are still ahead of the pace needed to achieve the USDA projection but today’s number certainly drive home the point that buyers have abandoned our shores and have taken their business to South America.
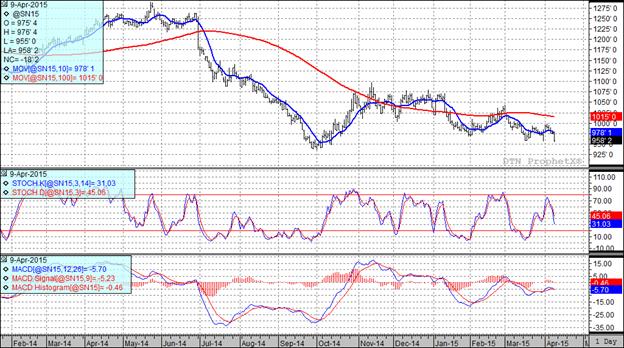
At the present time all three of my technical indicators are bearish the July futures while two of three are bearish the November futures.
Wheat:
There didn’t appear to be any surprises in the wheat numbers today. Looking at domestic carry-out, the March report gave us a projected number of 691 million bushels while the average trade guess for today was 692. The actual number came out at 684 million bushels today so I don’t see much of a story there. Looking at the world supply we see kind of the same story. In March the USDA gave us a number of 197.71 MMT to play with. Coming into this report the average trade guess was 197.51 MMT so today’s number of 197.2 MMT was right in line with expectations.
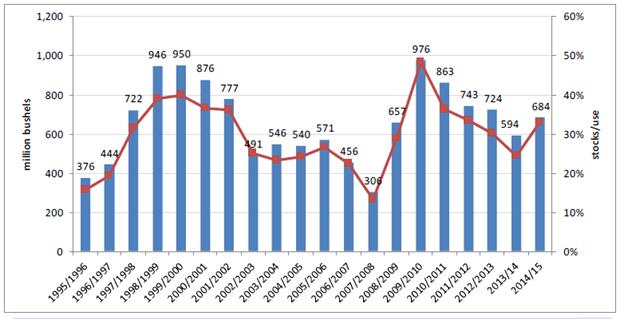
With no surprises in this market why did the prices get hit? I suppose in my position I can’t really get by with saying I have no freakin clue but in fact I really can’t explain it. We did see fund selling today and there is a forecast for normal weather in HRW country which some see as potentially beneficial. I also think folks were a bit surprised by the crop being rated as good as it was earlier this week and that is probably playing a role. Finally, we shouldn’t lose sight of the fact that we have an ample supply of wheat. As illustrated on the following chart we have a stocks to use ratio of 32.9% here in the USA while viewed from a world perspective we have a global stocks to use ratio of 27.6% and those are not the types of numbers that generally create big bull markets.
With today’s price action all three of my technical indicators are now bearish both the Minneapolis and Kansas City July futures.

Top Trending Reads:
- Grain Outlook for 2015
- How To Determine If Commodity Prices Are Too Low To Market Grain
- Using Futures Options In Grain Marketing
- Market Insider from the Farm and Ranch Guide
This data and these comments are provided for information purposes only and are not intended to be used for specific trading strategies. Commodity trading is risky and North Central Farmers Elevator and their affiliates assume no liability for the use of any information contained herein. Although all information is believed to be reliable, we cannot guarantee its accuracy and completeness. Past financial results are not necessarily indicative of future performance. Any examples given are strictly hypothetical and no representation is being made that any person will or is likely to achieve profits or losses similar to those examples.
North Central Farmers Elevator - 12 5th Ave. Ipswich, SD - 605-426-6021.


