Craig’s Closing Comments
April 10, 2015
Yesterday I ran the latest drought map and thought I would follow up on that a little bit today. According to the latest report from NOAA the past three months are the driest first three month of a year that we have experienced since 1988. For those of you that can’t remember that far back I can attest that it was extremely dry that year. In fact I have vivid memories of seeing two trees fight over a dog. Here in good old SD we actually set a record this year for the driest January through March on record. As you could see from the map last night, the drought has continued to expand with 36.8% of the USA now experiencing a drought of some type or another. I would be the first to admit that rains could show up at any time and give us a heck of a crop but right now it sure looks like it could be an interesting year.
Corn:
I was reading a financial report last night and came across this tidbit: As measured by the Consumer Price Index, it now takes $1 to buy what could be bought for 13¢ in 1965. On April 9, 1965 the December corn futures closed at $1.21 so if my math is correct we would need to see the December futures at $9.30 ¾ to have the same buying power per bushel. Of course, a lot of other things have changed as well such as dramatically improved yields, never-the-less it is kind of interesting to look at. The reason I am spending time looking at 1965 prices and playing math games is because the market itself was kind of boring and gave us very little to write about today.
Because it was a little slow today I am going to do something different and just list a few bullish and bearish fundamentals that were talked about by the trade today.
BULL
- Slow producer selling.
- Poor weather conditions in the Delta and southeastern areas of the USA, i.e. too much rain.
- Potential drought fears in the western Corn Belt.
BEAR
- Ample world supplies.
- Slowing export demand.
- A strong USA dollar.
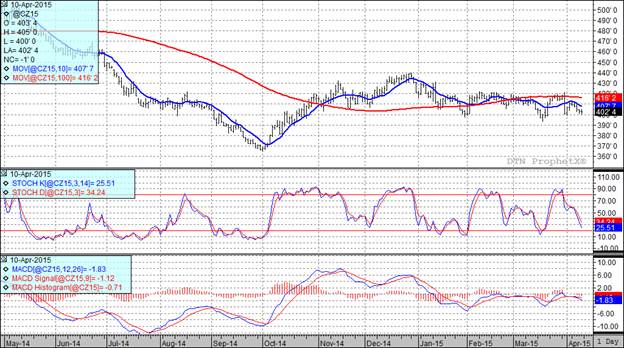
All three of my technical indicators are currently bearish for both the old and new crop futures.

Soybean:
BULL
- A lack of producer selling.
That is all I can come up with on the bullish side for beans this afternoon which of course is why the bean complex struggled so much during today’s trade.
BEAR
- We are in the process of harvesting of a record crop of beans in South America.
- Demand for USA soybeans is diminishing as China continues to shift from USA to South American suppliers.
- It appears that rain will linger over the Delta and southern areas of the USA for the next 10 days or so. This has traders contemplating the possibility that we will see and increasing number of farmers switch acres from corn to beans.
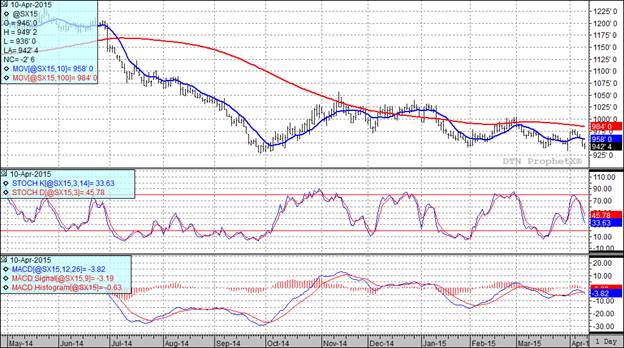
At the present time all three of my technical indicators are bearish both the July and November soybean futures.

Wheat:
BULL
- There is a very real concern over the dryness that we are seeing in key parts of the USA winter wheat areas. In spite of forecasts for chances of rain next week traders remain very nervous.
BEAR
- Global supplies of wheat are more than ample.
- There don’t appear to be any major crop production concerns in the rest of the world at this time.
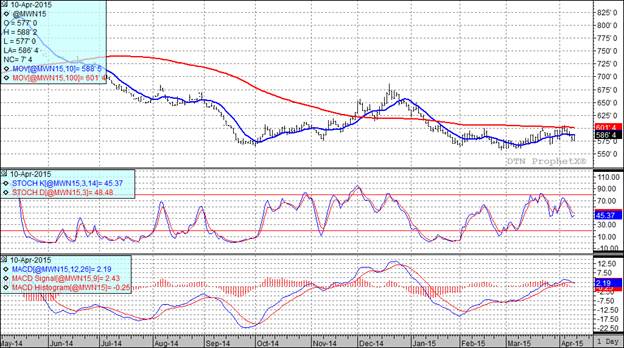
In spite of today’s better close all three of my technical indicators are still bearish both the Minneapolis and Kansas City July futures.


Top Trending Reads:
- Grain Outlook for 2015
- How To Determine If Commodity Prices Are Too Low To Market Grain
- Using Futures Options In Grain Marketing
- Market Insider from the Farm and Ranch Guide
This data and these comments are provided for information purposes only and are not intended to be used for specific trading strategies. Commodity trading is risky and North Central Farmers Elevator and their affiliates assume no liability for the use of any information contained herein. Although all information is believed to be reliable, we cannot guarantee its accuracy and completeness. Past financial results are not necessarily indicative of future performance. Any examples given are strictly hypothetical and no representation is being made that any person will or is likely to achieve profits or losses similar to those examples.
North Central Farmers Elevator - 12 5th Ave. Ipswich, SD - 605-426-6021.


