Craig’s Closing Comments
April 13, 2015
I did some thinking over the week-end and have a couple general comments on things I feel are impacting grain prices right across the board.
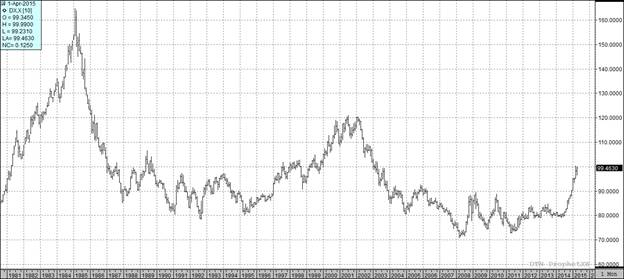
1) We need to keep an eye on the dollar. As you can see on the following monthly continuation chart, the dollar has bounced back lately and is now trading about as high as any level we have seen since April 2003. This makes it increasingly difficult to be competitive in the export market and thus puts downward pressure on commodities.
2) My second thought was that I have probably been guilty of trying to trade my backyard. I have been of the opinion that we will see some production problems this summer that will provide better pricing opportunities than we are seeing right now. I still think that may be the case but in my veal to promote what I am seeing in our trade area I took my eye of the bigger picture. We had the weekly planting progress and crop conditions report out today and as a part of that they give you a reading on top soil and sub soil conditions. In South Dakota the top soil is rated at 69% short to very short while sub soil moisture checks in at 65% short to very short. That reality has colored my perception of how I see the growing conditions and I suspect it has impacted your view of the world. The problem is that if we look from a national perspective we see that only 24% of the country is short to very short top soil moisture while 23% is reported in the same category for sub soil. Interestingly enough 24% is reported as having surplus top soil moisture with 19% reporting surplus sub soil. In fact the most important number in today’s report may be the state of Ohio where they are reported as 66% of the topsoil having surplus moisture. Wouldn’t it be interesting if we had a weather rally not because the western Corn Belt is to dry but because the eastern Corn Belt was to wet? As hard as it is to ignore the conditions in ones backyard the most successful marketers will be able to put that aside and trade the national picture.
3) Since we are talking drought we may as well talk pestilence as well. This week-end we saw the avian flu (H5N2) move from only impacting turkey producers to being confirmed in a commercial 200,000 bird chicken flock in Jefferson County Wisconsin. This makes 20 flocks that have been impacted thus far with turkey flocks accounting for the other 19. If this continues to spread it will have a negative impact on feed demand.

Corn:
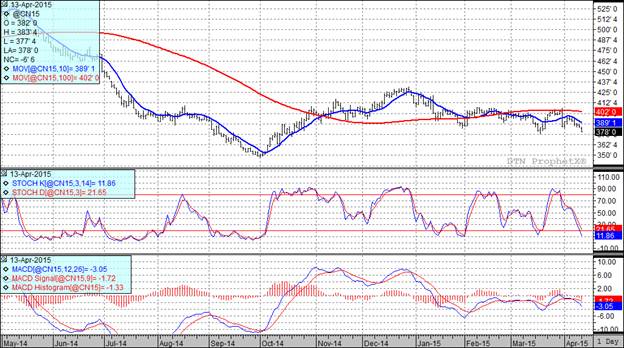
We had a day in which there was very little news and what we did have seemed to fit within the parameters of what was expected. The weekly export inspections were out this morning and at 33.69 million bushels they were within the range of trade estimates. When wheat started trading sharply lower on improving moisture conditions that seemed to impact the corn pit as well taking us lower for the day. After the close we had the planting progress report. The trade was looking for a number of around 5% planted so I assume they were a touch surprised when only 2% of the crop was reported as being in the ground. If memory serves me correctly I believe that we had 6% of the crop planted at this point last year while the five year average is 5% planted on this date.
With today’s close we have now closed lower for the past six sessions. I suspect we are getting close to having a positive bounce even if it is just of the dead cat variety for the time being.
All three of my technical indicators are currently bearish for both the old and new crop futures.

Soybean:
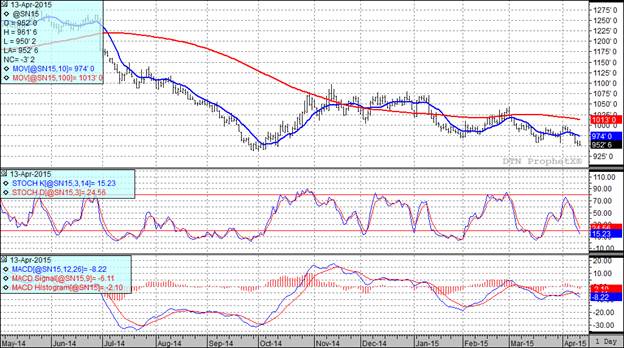
Weekly export inspections came in a touch over 16.5 million bushels which was within the range of trade expectations so no real surprise there. It is interesting to note that year to date exports are running 11% ahead of last year’s pace with the USDA currently forecasting when the smoke clears we will experience a 9% in export sales over last eyar. The Chinese are going to have a lot to say about that so it was good to see them announce that their soybean imports for the month of March were up 5.4% from February. What was left unstated was that they were down 3% compared to last year but we don’t want to let little details like that get in our way. I am hearing reports that the Chinese crush margins remain weak, but the analysts expect them to improve further out which should be positive. Speaking of crush, we will get the monthly NOPA report on Wednesdayand the general consensus is that it will be a pretty big number. Maybe big enough to slow the bleeding this market has been experiencing the last week or so.
At the present time all three of my technical indicators are bearish both the July and November soybean futures.

Wheat:
Looking at the wheat market I kept thinking about the joke about the reporter who asked Mrs. Lincoln – “How was the play other than that Mrs. Lincoln?”
The most positive thing that I saw today was that the weekly export inspections came in at 16.376 million bushels which was at the upper end of the range of trade guesses.
What we had today was a good old fashioned weather market. Rain in HRW country with the prospect of more triggered selling in the market. We did see some maps reduced the amount of rains that western Kansas is projected to get but by the time those maps came out we had a good old fashioned bearish runaway going and there was no turning back today.
It wasn’t just the weather in the USA that was seen as bearish. Ukraine and Russia are expected to receive beneficial rains over the course of the next few days. China and Australia are also expected to receive beneficial rain for their wheat crops. Adding to the woes of wheat bulls were rumors that the Russian’s have decided to allow the existing wheat export tax to expire as scheduled at the end of June. That probably means we will see a Kmart blue light special on wheat out of the Black Sea region.
After the close we had the weekly Crop Progress report which showed spring wheat 17% planted compared to 5% last year, and an average of 11% planted. Looking at winter wheat they have 42% rated as good/excellent compared to 44% good/excellent the prior week.
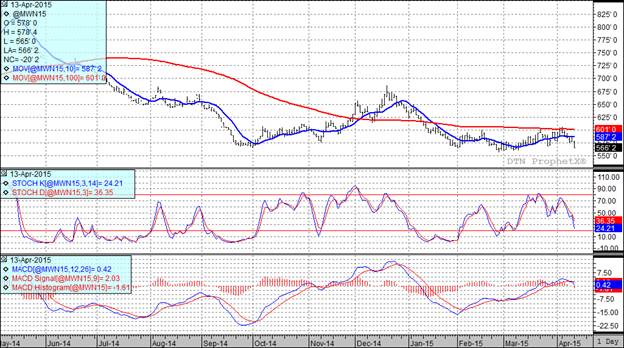
With the severe beating the wheat market experienced today it is no shock to anyone who has been paying attention that all three of my technical indicators remain bearish both the Minneapolis and Kansas City July futures.


Top Trending Reads:


