Craig’s Closing Comments
April 15, 2015
In honor of the day I thought I would lead out with this quote by Ronald Reagan - “The taxpayer: that’s someone who works for the federal government, but doesn’t have to take a civil service examination.”
Here are a couple of other interesting tax related items:
- Americans will collectively spend more on taxes in 2015 than they will on food, clothing, and housing combined.
- Americans will pay $3.3 trillion in federal taxes and $1.5 trillion in state and local taxes, for a total bill of more than $4.8 trillion, or 31 percent of the nation’s income.
Finally, I would like to point out that this year Tax Freedom Day falls on April 24th. Tax Freedom Day is significant in that it represents how long Americans as a whole have to work in order to pay the nation’s tax burden. In other words as we pay our taxes today we can enjoy knowing that we only have to work 9 more days this year to pay the governmental taxes and then beginning on April 25th we will actually get to start keeping the money we earn. It is sure a good thing that is no waste in government or this statistic could kind of tick a guy off.
Corn:
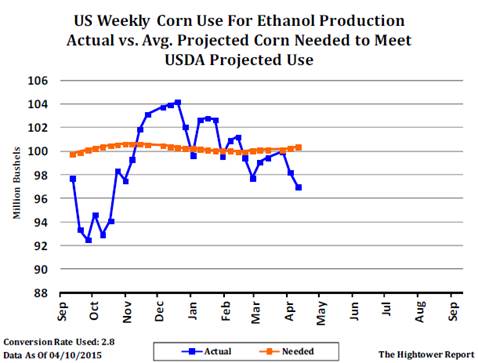
We had very limited news in the corn market today. One thing that we do have to talk about is the weekly ethanol report. That was released this morning and reported that last week we used up 97.02 million bushels of corn in the production of ethanol. That is the lowest usage of any week so far this year and leaves us needing to average 100.347 million bushels per week for the remainder of the crop year to hit the USDA’s ethanol usage projection.

After the trade finished digesting the weekly ethanol report they were then left with weather and the dollar to guide the market direction. As far as weather goes, the western Corn Belt remains dry which is conducive for field work but could lead to drought concerns down the road while in the eastern Corn Belt and Delta wet conditions continue to slow planting progress. As far as the dollar goes, we saw it trade lower today which was supportive to grain prices in general.
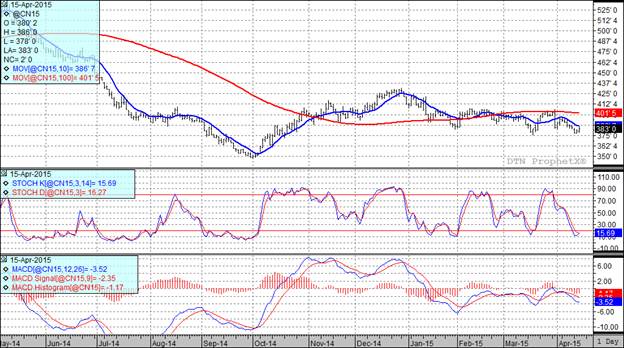
In spite of the better close, all three of my technical indicators remain bearish for both the old and new crop futures.

Soybean:
We had a pretty interesting day in the bean market today. We followed up yesterday’s higher close by opening higher once again today. The stronger market was attributed to short covering in the bean market with traders also mentioning slow farmer selling and strong basis in the eastern Corn Belt. Coming into the release of the 11 a.m. NOPA crush report we had the July futures trading up $0.15 ¼. The trade was looking for the report to show 155.3 million bushels of beans crushed last month which would have been a record crush for the month of March. At 11 a.m. the report was released and traders were shocked to see a number of 162.822 million bushels posted. In other words the crush was nearly 8 million bushels larger than what the trade was looking for and of course it reacted to this bullish news by breaking from the highs. It kind of looks like a classic buy the rumor; sell the fact kind of reaction.
I have seen national estimates that nearby soybean crush margins are running around $1.65 per bushel which should mean that the processors will keep crushing soybeans at an accelerated rate.
The weather in South America is also seen as supportive right now as rains in Argentina are leading to some harvest delays.
Finally, it should be noted that the avian flu story continues to grow with a turkey farm in Iowa now reporting an outbreak as well as an additional 8 cases being confirmed on farms in Minnesota.
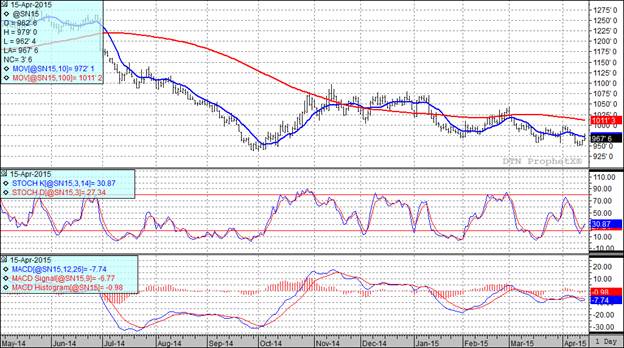
In spite of today’s stronger close two of my three technical indicators remain bearish both the July and November soybean futures.

Wheat:
This is kind of a broken record with ample supplies and improving weather weighing on wheat prices.
From a weather perspective the 1-5 day precipitation maps that I have looked at continue to show significant coverage in the Southern Plains. That should translate into improving crop conditions for HRW.
It isn’t just the winter wheat in the USA that is improving as the winter wheat regions of Ukraine and Southern Russia have also receive beneficial rains, and are forecast for additional general coverage Thursday through Saturday.
Monday’s planting progress report for spring wheat in the USA showed us ahead of the five year average and that is the case in Russia as well with spring grains plantings in that nation also ahead of their five year average.
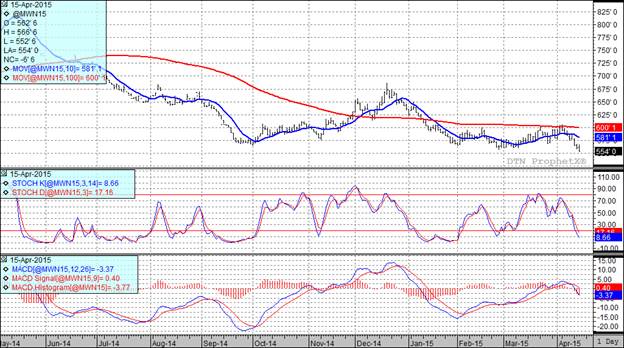
In summary we have improving weather, good planting pace and large world and domestic supplies. With that scenario it is understandable that we set new life of contract lows in both the Minneapolis and Kansas City July wheat futures today.
At the present time all three of my technical indicators remain bearish both the Minneapolis and Kansas City July futures.


Top Trending Reads:


