Closing Comments
Craig Haugaard
April 27, 2015
Corn:
We kicked off the day with the weekly export inspections report. The number came in at a very solid 50.9 million bushels which was above the top end of the range of trade estimates as well as ahead of the 34.1million bushels that we need to post each week to hit the annual USDA export estimate. In spite of being a surprisingly good number it only provided brief support to the market and then the traders got back to beating on it.
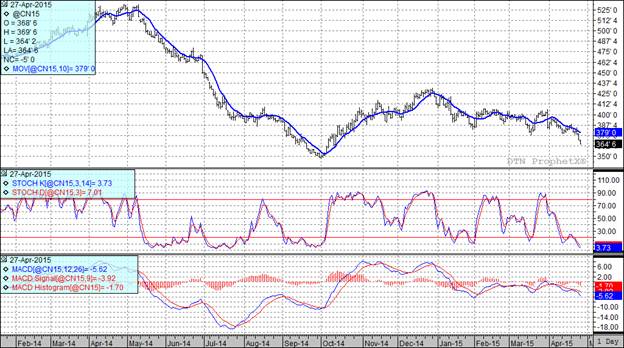
The reason for the beating is that the weather forecasts for the next couple of weeks look like the weather will provide pretty good planting conditions and thus the trade pushed the market to the lowest level we have seen in 5 ½ months.
After the close we had the planting progress report. For the week ending April 26th the crop was reported as 19% planted. That is exactly where the average trade guess was but lags the five year average of 25% planted. A couple of states really jumped out at me as lagging in planting progress. Indianan checked in at a mere 3% planted versus the five year average of 26% while Ohio checked in at 2% planted versus a five year average of 20%. Looking at the soil moisture conditions one can see why the planting is lagging in those two states. In Indiana the top soil is rated as 45% surplus with subsoil checking in at 37% surplus. In Ohio we have top soil pegged at 40% surplus with subsoil levels being 32% surplus. I spoke with a fellow in Indiana today who told me he thought they would be in the field by Wednesday but then beginning on Saturday they had chances of rain for the next ten days. I know we have been fixated on our own drought conditions but keep an eye on the eastern Corn Belt. If planting delays continue this may generate some talk of yields slipping and start to generate a weather related rally. Of course, a drought is still a real possibility for our part of the world but we probably wouldn’t see the market start to reflect that until late May or early June.
At the present time all three of my technical indicators are bearish both the July and December futures.

Soybean:
We had a little stronger close in beans today. The market was assisted by the weekly export inspections report which showed 11.5 million bushels being inspected for export. We only need to average 5.6 million bushels per week to hit the USDA’s annual projection so today’s number was certainly seen as supportive. Also supportive was the rumor that China had just purchased some cargoes of beans from the USA for October shipment. It looks like the Chinese may be going to implement changes in their VAT tax which should have the end result of improving crush margins in that nation and in theory improve demand for beans from the USA.
The trade was looking for a planting progress number of 3% planted so tonight’s number of 2% was dead on and not that far out of line with the five year average of 4% planted on this date. Of course if I wanted to be a real journalist I could spin that number and come out with this headline: Bean Plantings Only Half of Last Year: Women and Children Expected to Suffer the Greatest Impact. On a side note I did take a bunch of journalism classes in college and as evidenced by the above headline it appears I still have some major skills in that area. J
In South America we still hear some rumblings about another trucker strike but frankly with harvest winding down it doesn’t look like it will be very disruptive so this is a story that will probably go away for a few months.
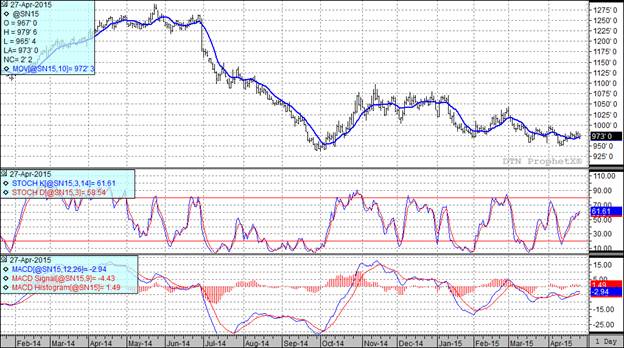
At the present time all three of my technical indicators are bullish the July futures and two of three are bullish the November soybean futures.

Wheat:
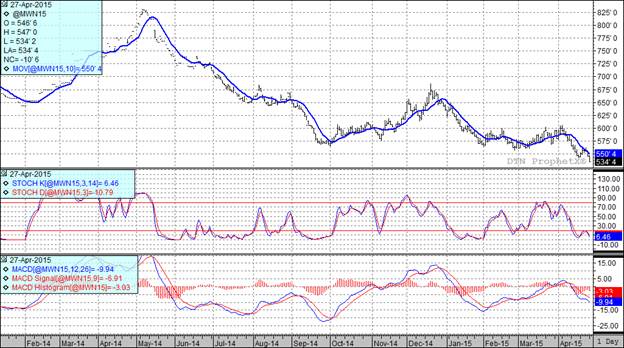
When you have just posted another life of contract low it is tough to find anything positive to talk about and that is where we find ourselves with wheat this afternoon.
With ample supplies of wheat both domestically as well as worldwide and an absence of any real major production problems at the current time we continue to see funds add to their short position which in turn has taken us to levels not previously seen in the life of these contracts.
Here in the USA good planting conditions were reflected in this afternoons planting progress report. For the week ending April 26th it is reported that 55% of the spring wheat has been planted, well ahead of the five year average of 29% planted for this date.
Winter wheat conditions were reported as 42% good to excellent. That number is unchanged from last week and is certainly better than the 33% good to excellent rating we had a year ago at this point.
At the present time all three of my technical indicators are bearish both the Minneapolis and Kansas City July futures.


Top Trending Reads:


