Closing Comments
Craig Haugaard
April 28, 2015
I found myself reading North Carolina folklore last night with special interest on how to make it rain. They had a number of great suggestions that I thought I would pass on to you because as dry as it is trying some of these couldn’t hurt anything.
1) To make it rain, kill a snake and lay it belly up on a fence.
2) When the peacock screams rain follows.
3) If a dog eats grass it is going to rain.
4) When horses sweat in the stable, sniff loudly, and switch their tails violently you may expect rain.
5) Bathing a cat causes rain.
So, there you have five good folklore signs or events that will bring about rain. I may start on this tonight by holding my wife’s cat underwater for a while and if that doesn’t do the trick move on to some snake killing.
Corn:
While we are on the subject of water I have been having a discussion the past couple of days with a learned gentleman who has been dazzling me with facts about the amount of water that it takes to grow a crop. Looking at it from a national perspective, what does it take to grow a crop? There seems to be some discrepancy as to how much water is required to grow a bushel of corn. USDA Agricultural Research Service (ARS) engineers in Colorado ran a series of test and declared that it takes 2,500 gallons to produce a bushel of corn while the Oldham County Water District in Kentucky says that it takes 4,000 gallons to produce a bushel of corn. Let’s go with the low estimate and use 2,500 gallons per bushel. Now let’s assume that we will plant 88 million cares to corn this year and have a national average yield of 165 bu/acre. To figure out how much water that would take we need to take acres times yield times gallons per bushel. In the case of our hypothetical it would look like this - (88,000,000 x 165) x 2500 = 36,300,000,000,000. In other words it takes 36.3 trillion gallons of water to grow a trend line yield of corn in the USA. If the Oldham County folks are correct that number moves 58.08 trillion gallons. To take it one step further, I am told that a gallon of water weighs 8.344 pounds so that means that to get trend line yield for corn requires between 302,887,200,000,000 and 484,619,520,000,000 pounds of water to grow a trend line yield crop this year.
By now I am sure some of you are thinking, “Haugaard, this must have been a real slow day if you can waste this much time writing about the water needs of corn.” If you are thinking that you are absolutely correct. The truth is that we had light volume today and basically ended up unchanged for the session. We did see some fund selling as they continue to add to their short position. On the other hand I am hearing from some traders that they feel corn may be becoming oversold given uncertainty of US summer weather.
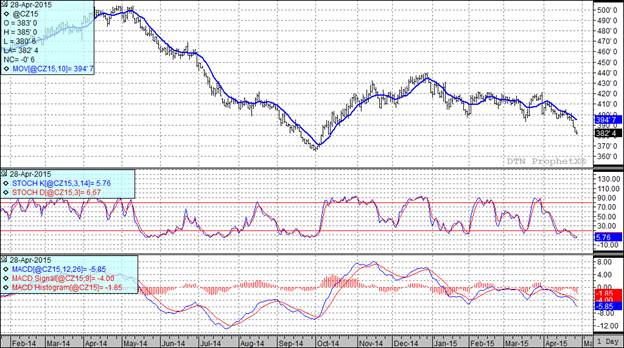
At the present time all three of my technical indicators are bearish both the July and December futures.

Soybean:
We started off the morning with an announcement from the USDA 390 TMT of new crop soybeans had been sold to unknown. That popped us higher right out of the gate and we stayed nicely higher until about 12:30 where we saw the market break off of the highs. We closed up for the session but roughly $0.11 off the session high.
As is the case with corn, this market is very sensitive to the weather at the current time. Today we saw traders buying beans and sell corn on a spread under the assumption that the good weather and fast planting pace will result in more corn acres and less than expected soybean acres. As planting moves forward the current weather forecasts show a fairly wide open planting window for 5 days in much of the USA and then the 6 to 10 day forecast is giving us above normal temps and precipitation for the bulk of the Corn Belt.
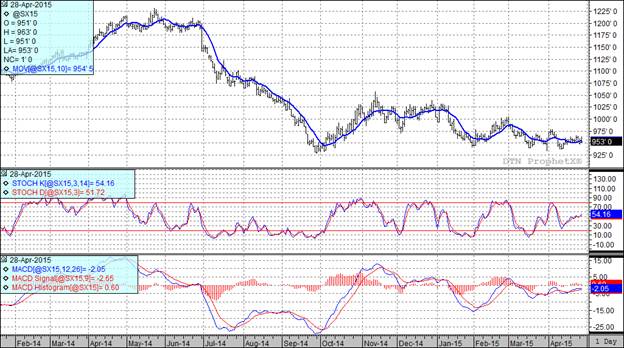
At the present time all three of my technical indicators are bullish both the July and November soybean futures.

Wheat:
Early on we saw the funds resume their selling of this market. In fact they hit it hard enough to drive it to new life of contract lows prior to the market staging a rally late in the session and posting higher closes for the day.
Much of the negativity today was a result of the rapid spring wheat seeding where, as we noted yesterday, planting is 55% complete versus the 5 year average of 29%. With good weather this week the trade is expecting that we will have over 80% of the crop in the ground when next week’s progress report is released.
If you are bullish and looking for something to hang your hat on it may come out in next week’s Wheat Quality Council Hard Winter Wheat Tour. I continue to hear rumors of disease and insect pressure in portions of HRW country and if that in fact exists I would expect it to show up in next week’s tour and perhaps put an end to the bleeding this market has been experiencing.
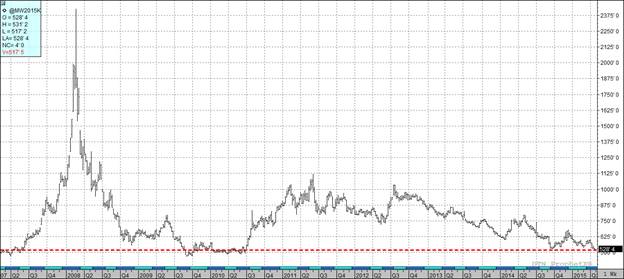
At the present time all three of my technical indicators are bearish both the Minneapolis and Kansas City July futures. That is probably no big surprise given the fact that we are trading at the lowest price levels we have seen since 2010. The following is the weekly continuation chart for the Minneapolis futures and illustrates the depths to which we have fallen.


Top Trending Reads:


