Closing Comments
Craig Haugaard
April 30, 2015
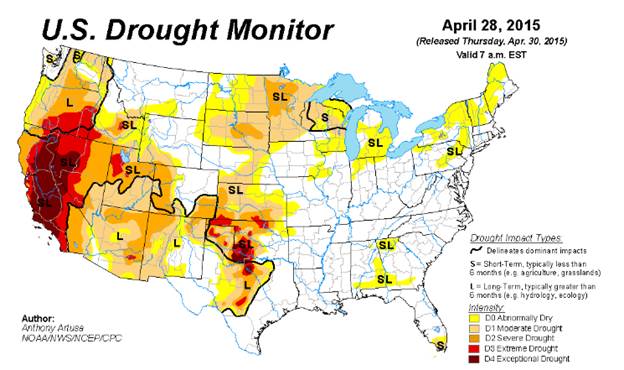
We had a fresh weekly drought map released today so I am going to run that for your viewing pleasure. I don’t think it will shock any of you to see that we according to the map we are dry in our trade area.
Corn:
We started the morning off with the weekly export sales report. Corn sales came in at 32.8 million bushels which was above the top end of the range of trade estimates. As you can see from the following graphic, we continue to run at a pace that far exceeds what we need to average to achieve the USDA’s projection.
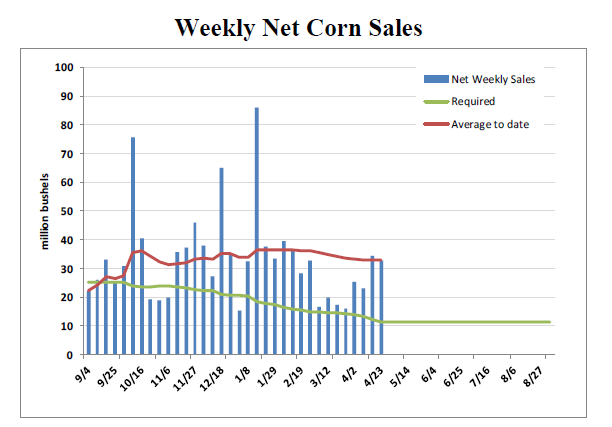
While that would appear to be bullish the traders swiftly shrugged it off and pressed the market lower.
Domestically, the trade continues to focus on the rapid planting pace. Once the crop gets planted we will probably see the trade start to pay a little more attention to areas, such as our trade area, that are experiencing some very real production risks.
On the international front I did hear that Brazil sold South Korea corn for October shipment at a price that was a steep discount what is being offered from the USA. Other news out of South America seems to prove that the old adage about big crops getting bigger is not unique just to the USA as the Buenos Aires Grains Exchange is now estimating Argentina's 2014/15 corn crop at 25 MMT, up from their previous estimate of 23 MMT.
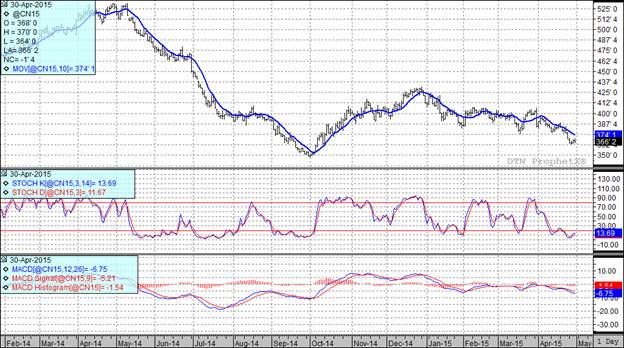
At the present time two of my three technical indicators are bearish both the July and December futures.
Soybean:
Soybeans started off strong with export sales that were above the top end of the range of trade guesses. For the week they came in at 15.92 million bushels which, as you can see on the following graphic is well above the pace we need to maintain to achieve the USDA’s projection.
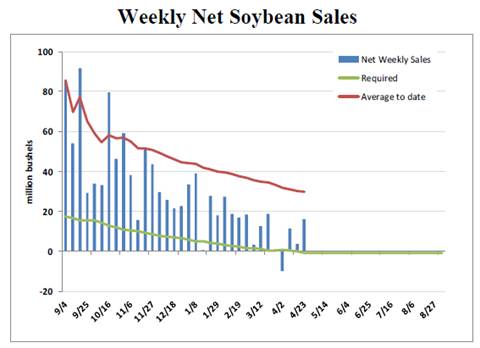
While the exports were bullish the market was pressured by the thought that this perfect planting weather will allow the bean crop to go in rapidly as well. We also saw some pressure in the market based on the continuing spread of the bird flu throughout the Midwest.
The most bearish factor however may have come from Argentine where it appears that the strike has been resolved and the operations at the Rosario Port are back to normal.
On the heels of that news we also had the report from the Buenos Aires Grains Exchange increasing their estimate of Argentina's 2014/15 soybean crop at 60 MMT, up from their previous estimate of 58.5 MMT.
At the present time two of my three technical indicators are bearish both the July and November soybean futures.
Wheat:
So far this week the news has been fairly consistently bearish as we continue to talk about the rapid seeding pace of HRS where it is expected 80% or more will be reported as seeded in next Monday’s report. We have also been subjected to a steady drumbeat of conjecture that Russia is going to drop their export tax. That became more of a reality today with the news that Russian officials will meet sometime in May to vote on a proposal to drop the export tax early.
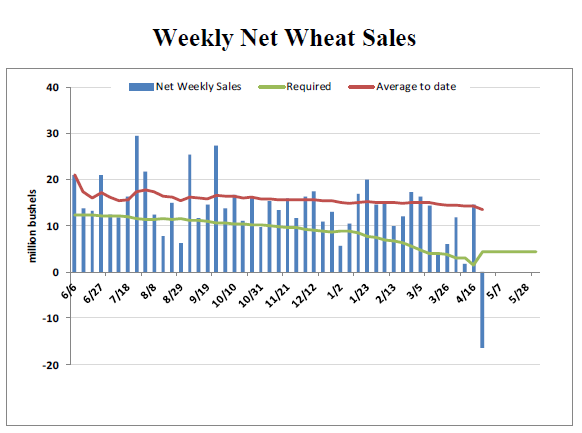
What was different about today was that we took the bearish stuff we have been dealing with and added abysmal weekly export numbers to it. In fact the weekly export sales came in this week as net cancellations of 16.5 million bushels. Even my slow cousin Jimmy knows that net cancellations is not the way to inspire a bull market. The marketing year ends on May 31 and we only need to average 4.43 million bushels per week to hit the USDA projection so we shouldn’t end up too far from the USDA number but the psychological impact of today’s report was certainly negative.
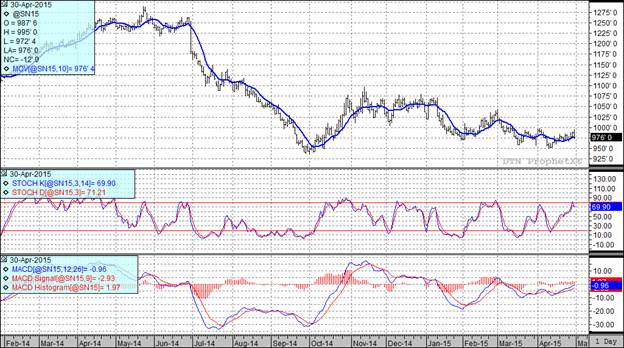
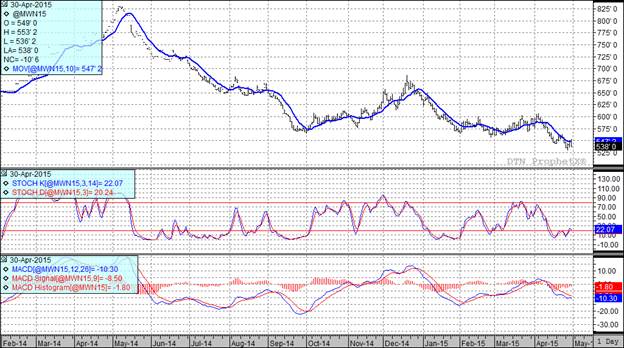
At the present time two of my three technical indicators bearish both the Minneapolis and Kansas City July futures.

Top Trending Reads:


