Closing Comments
Craig Haugaard
May 6, 2015
Corn:
The corn market is pretty interesting right now. It kind of reminds me of the line from The Rime of the Ancient Mariner - Water, water, everywhere, Nor any drop to drink. In the world of corn it seems to be bins and bins of corn everywhere but not a kernel to grind. We are hearing that end users in some parts of the Corn Belt are struggling to originate bushels. Even though supplies are plentiful the pipeline seems to be a little tight and this has led to improving basis. At the end of the day the basis can only do so much before the futures have to take the lead and there is a school of thought that this may be about to happen in the corn market. Kind of hand in hand with that I heard that an informal survey was taken of corn traders in the USA and the general consensus is that you guys are not going to sell your corn until late summer. It is probably not wise to put much stock in informal surveys but the fact that folks are talking would seem to indicate that folks are nervous and may have to pay up to get the bushels they need. I would caution you to not be too late leaving the party. You don’t want to be like the guy that cornered the pumpkin market and could have sold for a fortune on October 31st but decided to wait and see if he could get more on November 1st. In the words of that renowned marketing genius, Kenny Rogers;
You've got to know when to hold 'em
Know when to fold 'em
Know when to walk away
Know when to run
The weekly ethanol production report showed a sharp decrease in the amount of corn used to produce ethanol last week. For the week it is estimated that 93.135 million bushels were used in the production of ethanol. That leaves us needing to average 101.044 million bushels per week to achieve the USDA’s annual projection.
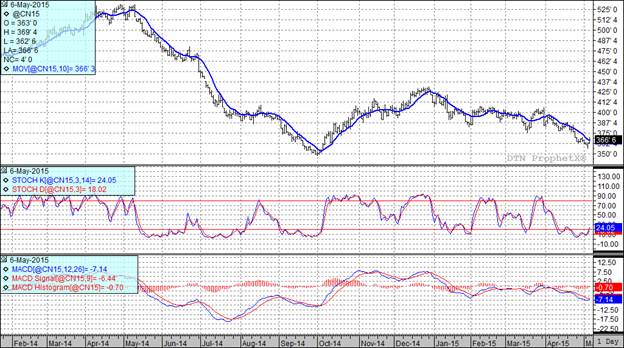
At the present time two of my three technical indicators are bullish the July futures while two of three are bearish the December futures.

Soybean:
We started off stronger today as the trade was abuzz with usual trifecta of bullish news, increased soybean purchases from China, the reluctance of the USA farmer to sell beans and the fear of a lengthy worker strike in Argentina. As the day wore on the attention seemed to shift to the forecast for drier conditions in the Eastern Corn Belt which should allow for increased bean planting to take place. I was also hearing folks talk about slow USA soymeal demand as well as a slowdown in Chinese soybean meal demand. That took some of the fight out of the bulls as resulted in a lower old crop close.
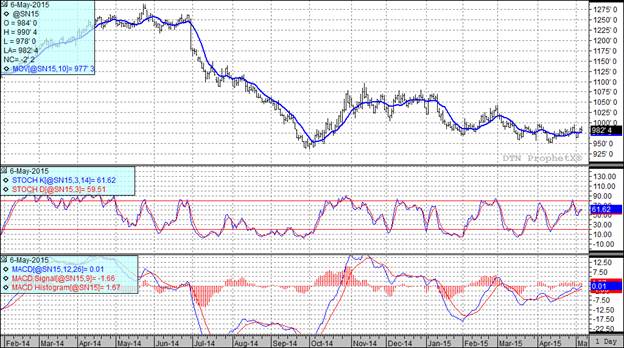
At the present time all three of my technical indicators are bullish both the July and November soybean futures.

Wheat:
The trade had a chance to look at the yield estimates from the first day of the HRW tour and I think they were surprised by how bad they were. Crop scouts on the first day of the wheat tour predicted an average yield of 34.3 bushels per acre. A year ago these same fields were estimated to be at 34.7 bushels per acre. In fact this year’s numbers were the lowest yield projection seen for the first day of the tour since 2001. Today they were scouting from Colby to Wichita, KS, an area that is expected to be the lowest yielding area this year. This news helped to jump start the wheat market and the Stats Canada wheat stocks number was supportive as well. The trade was looking for a stocks number of 17.7 MMT and was caught by surprise when the actual number was announced at 16.738 MMT. A year ago the stocks number stood at 21.86 MMT. A few years ago I referenced the Stats Canada number in my comments and quickly had a Canadian reader point out that their governmental agencies are not any better than ours so we should treat Stats Canada numbers with the same “respect” we give those from the USDA. Good point but never-the-less these are the numbers we were trading today.
I heard a little more on the rumor that the Russians are going to cut their wheat export tax sooner than anticipated. The story today is that they are going to cut it from 35 Euros per metric ton to 1 Euro per metric ton effective May 15th.
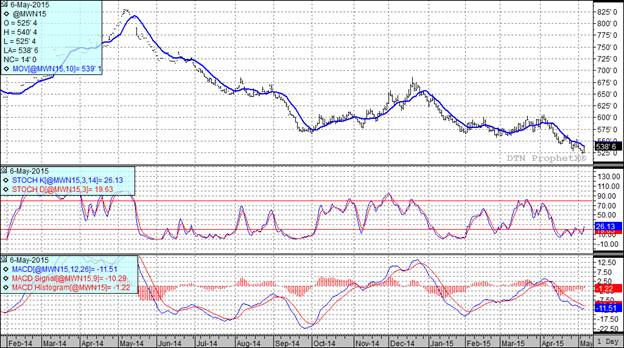
At the present time two of my three technical indicators are bearish both the Minneapolis and Kansas City July futures.


Top Trending Reads:


