Closing Comments
Craig Haugaard
May 7, 2015
Corn:
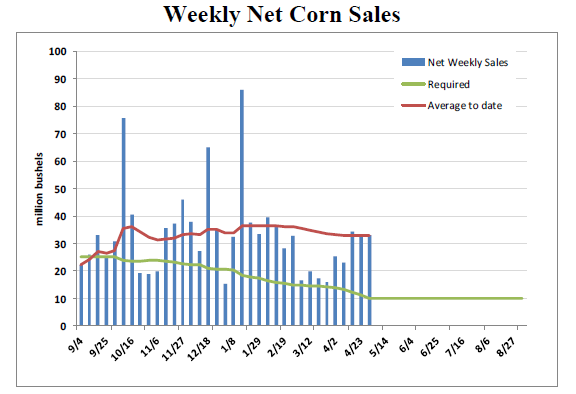
For what, if memory serves me, was the third consecutive week we saw the weekly export sales of corn come in above the top end of trade estimates. For the third week in a row the market traded lower on that seemingly positive news. I guess we should be thankful that exports were not below expectations or they might have taken us limit down.
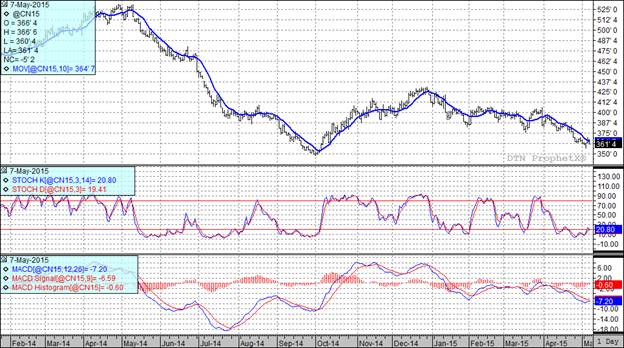
While the exports were bullish at the end of the day what the trade is focusing on right is the weather and at the current time that is nearly ideal for crop development in much of the Corn Belt. A stronger dollar also pressure prices today as did an announcement from China in which they increased their corn production forecast for 2015/2016.
At the present time two of my three technical indicators are bearish both the July and December corn futures.
Soybean:
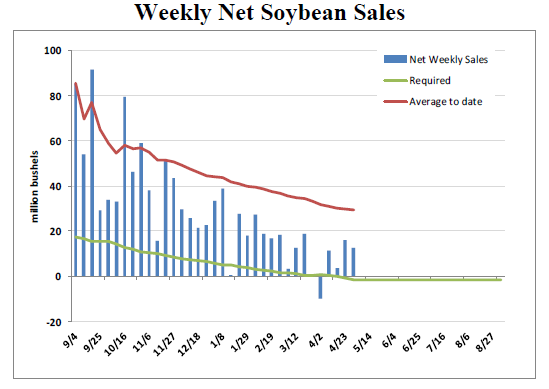
The weekly export sales on soybeans came in at the top end of the range of trade guesses and as you can see on the following chart we are now in the position of needing net weekly cancellations for the rest of the marketing year if we are to achieve the USDA’s annual projected exports number. I don’t think I am going too far out on the limb to predict that they will be increasing their projected export number in the not too distant future.
Good weather and a stronger dollar were the driving factors in the market today. The pace of least resistance was lower. We also saw the funds get in on the action as they were sellers of roughly 4,000 contracts during today’s session.
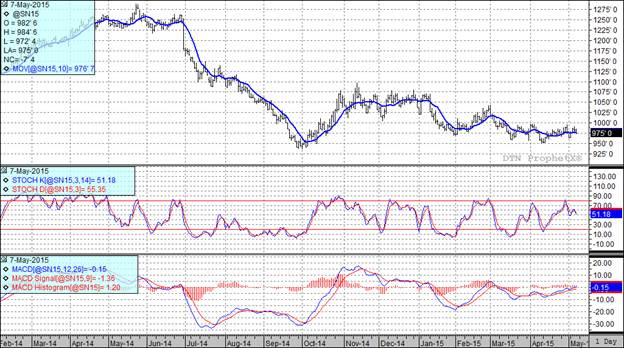
With todays close two of my three technical indicators are now bearish both the July and November soybean futures.
Wheat:
The results of the second day of the winter wheat tour came in a little better than expected. It was widely anticipated that the second day would show the poorest yield projection on the tour with many participants expecting to see numbers near last year’s levels. With that in mind the trade was surprised when the crop scouts on the Kansas Wheat Tour projected an average yield of 34.5 bushels per acre for the fields they examined on Wednesday. This was 0.2 bushels per acre larger than Tuesday estimate and certainly larger than last year’s ’projected 32.8 bu/acre for this same area. The five year average for this section of the tour is 36.98 bu/acre.
Today’s results are out as well and they indicate that the folks on the tour today wheat tour found yields that were slightly better yields than they expected. The tour is estimating the Kansas wheat yield at 35.9 bushels per acre versus the 5-year average of 40.3 bu/acre. Last year the tour checked in at 28 bu/acre. This translates to wheat production in Kansas of 288.5 million bushels this year. The five year average from the tour is an estimated production of 313.6 million bushels. Last year the actual production for the state was 246.4 million bushels.
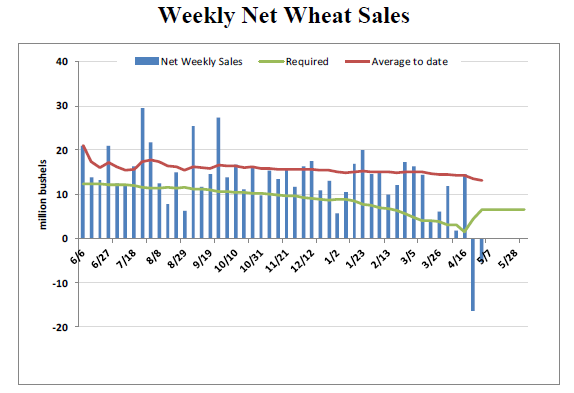
For the second consecutive week we saw net cancellations of wheat in the current marketing year. We are running out of marketing year and at this point I am willing to bet my first born child that we will end up with fewer exports for the year than what the USDA is currently projecting.
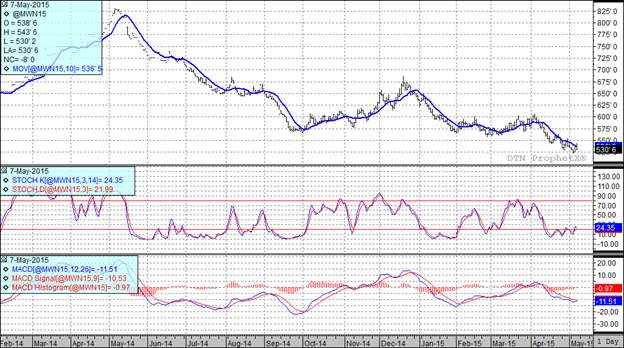
At the present time two of my three technical indicators are bearish both the Minneapolis and Kansas City July futures.

Top Trending Reads:


