Craig's Closing Comments
by Craig Haugaard
August 10, 2015
Corn:
Throughout the ages there have been questions that puzzled mankind. Questions of supreme importance such as, “Why is the sky blue?” or “Why does Teflon stick to a pan when nothing sticks to Teflon?” To this unknowable questions we can now add, “Why was the commodity market so much higher today?”
It appears that much of today’s bull move was driven by short covering and positioning ahead of the August 12 report. Early short covering pushed the market high enough to trigger some buy stops and we were off to the races. By the closing bell the funds had been buyers of 30,000 contracts for the session.
Beyond that the reasons for the rally become a little skimpy. On the weather front the Eastern Corn Belt didn’t get as much rain as expected over the week-end but this afternoon it looks like there is a system developing over Ohio and Indiana that could bring rain this evening.
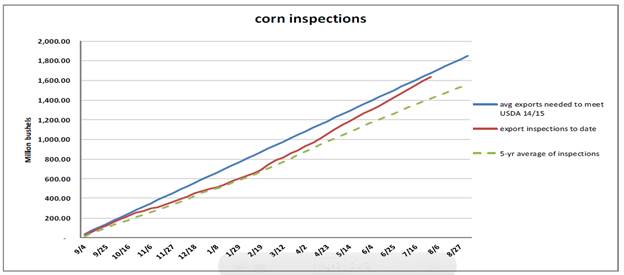
The weekly export inspections were towards the low end of the range of trade guesses but with only three weeks left in the marketing year it looks like we may end up between 25 and 50 million bushels behind where the USDA has been projecting us to be.

After the close we had the weekly crop ratings. The general consensus seemed to be that we would see the ratings drop by 1% so it probably caught the trade somewhat by surprise to see the ratings unchanged at 70% good to excellent. A year ago at this time the crop was rated at 73% good to excellent.
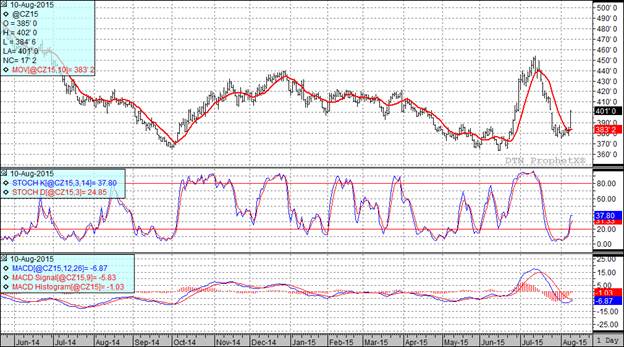
At the present time two of my three technical indicators are bullish both the September and December corn futures. There was a gap on the December corn dating back to July 27th which was filled today. The gap was at $4.02 which was today’s high. This could turn out to be a significant resistance point so it will be interesting to see if we can penetrate through that level and keep moving higher.

Soybean:
The lack of rain over the week-end in the Eastern Corn Belt helped get beans of to a solid start today. We then hit buy stops and saw traders all lining up to get a piece of the rock ahead of the August 12 report.
The weekly export inspections were nothing great, falling in line with trade guesses. However, with three weeks to go in the marketing year it would appear that export inspections will cause the USDA to ultimately increase their annual export projection to 25 to 50 million bushels. Interestingly enough that is also about the same amount I expect them to reduce corn by.
This afternoon it was expected that the crop conditions would slip by a point but instead they came out unchanged at 63% good to excellent. Year ago the crop was 70% good to excellent.
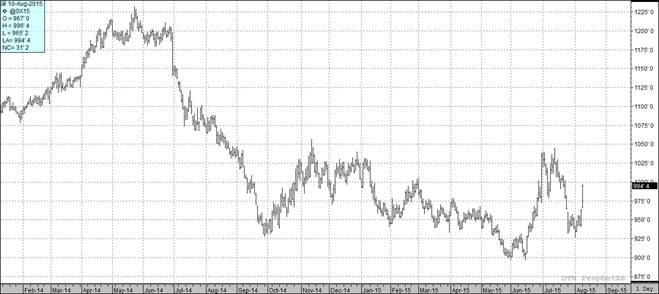
Today’s strong performance now has two of my three technical indicators bullish both the September and November futures. It is interesting to note that on the following chart we have an island gap in the November futures (circles in red on the following chart). This is a fairly rare formation that may signal the bottom to this market. Of course, it could ultimately serve no purpose other than temporarily exciting chart nerds everywhere. The chart nerds and funds were both excited today as the funds bought 13,000 bean contracts during today’s session.
['
Wheat:
The weekly export inspections came in at 13.4 million bushels. Interestingly enough that is also the ten week average for export inspections. The problem is that we need to average 19.5 million bushels per week to achieve the USDA projection. Of course, we have 42 weeks left in the marketing year is certainly have plenty of time to get to that level.
After the close the crop progress report indicated that the spring wheat crop is 28% harvested. That is a bit ahead of last year’s pace of 20% harvested on this date. According to a major cash wheat trader the “Mills are plugged to the gills” with wheat right now which doesn’t bode well for the basis in the near future.
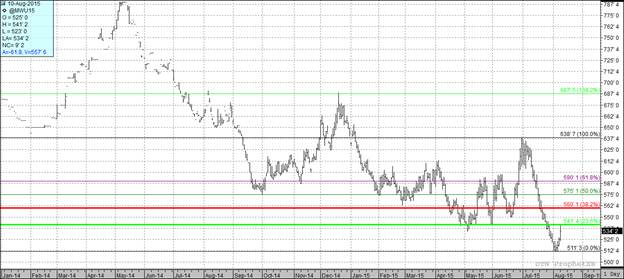
At the present time two of my three technical indicators are bullish both the Minneapolis and Kansas City September futures. I think it is real interesting that our old buddy Fibonacci identified $5.41 ½ as a resistance point and of course he high for the session was $5.41 ¼. We will want to keep an eye on this and see if we can break on through to the other side (little Doors reference mixed in with your market commentary tonight. J) If so the next level of resistance comes in at $5.60. I think it will be tough to push this market beyond that level.

Top Trending Reads:
Topics: Grain Markets
%MCEPASTEBIN%


