Craig's Closing Comments
by Craig Haugaard
August 13, 2015
They killed the kitty yesterday but we had the dead cat bounce today.
Corn:
After a sleepless night to digest yesterday’s report the trade was in a slightly friendlier mood today with the funds buying roughly 16,000 contracts during the session to propel us to a higher close for the day.
We continue to hear buzz surrounding yesterday’s report. A question that seems to keep coming up was if the USDA did an adequate job of reflecting the impact of the wet spring. One analyst I spoke with noted that last year Minnesota was ranked 111th out of the past 120 years for rain accumulation and the impact was that the state average yield came in 16 bushels below trend line. Now if we look at this year I see that Iowa, Illinois, Indiana, Missouri and Ohio are all checking in above their 112th ranking for the same time period. Now I am sure that the USDA nailed it yesterday, just because Minnesota suffered a yield reduction due to excess moisture last year doesn’t mean that it will happen this year. OK, that last sentence may have had a touch of sarcasm in it.
The weekly export sales number was out today and at 1.2 million bushels it pushed total export commitments for the year to 1856.5 million bushels or 6.5 million more bushels than what the USDA currently has projected for the total annual export number.
We also had some additional news from Europe where the drought is having an adverse impact on the crop. In a report out today Strategic Grains estimated the EU corn crop at 59.6 MMT, down from their previous estimate of 66.7 MMT. The USDA is currently projecting the EU crop at 62.25 MMT.
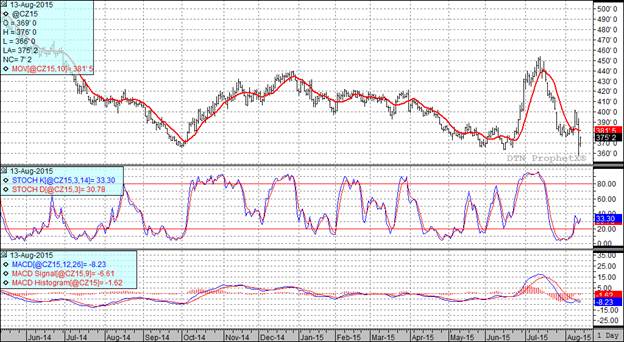
Today’s higher close wasn’t enough to undo all of the damage done yesterday so at the present time two of my three technical indicators are bearish both the September and December corn futures.
Soybean:
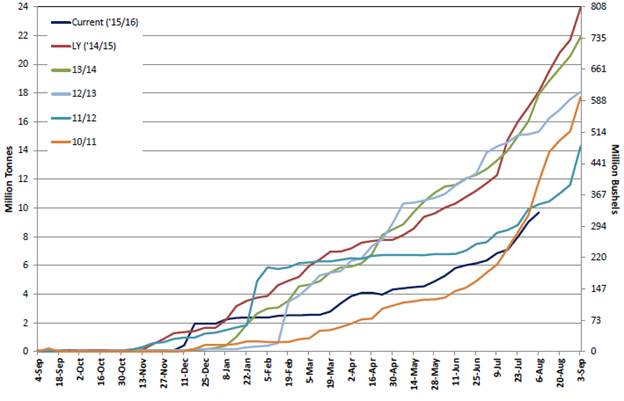
As we have discussed in this space in the recent past, new crop sales of soybeans are lagging this year as we have seen South America get sales to China in the time slot that the USA usually dominates. In fact, at the current time we only have 3.6 MMT of new crop soybeans on the books with China, a significant decrease from the 10.4 MMT we had sold to them last year at this time. The following chart gives you an historical perspective of how much we are lagging the sales pace of recent years.
In today’s weekly export sales report the old crop sales came in at 3.54 million bushels which pushed total export commitments for the year to 1.8643 billion bushels. The USDA has annual exports factored in at 1.825 billion bushels. I am really surprised that they didn’t increase the export number in yesterday’s report.
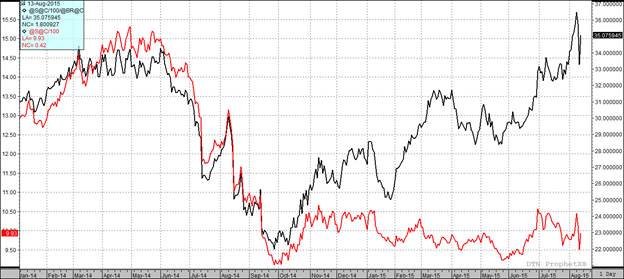
The Chinese economic story will continue to get attention. China devalued the Yuan for the 3rd consecutive day, a total of 4.6% this week. This has folks really nervous about the economic stability of this key trading partner. One group that the currency fluctuations have helped is the South American farmers. As you can see on the following chart, the weak Real and strong Dollar have dramatically impacted the price that Brazilian farmers receive for beans versus a farmer in the USA. The South American price comes at a time that farmers in South America are making planting decisions and it appears that we could see bean acres increase as much as 5% over last year.
Weather will also remain a story and with 20% of the soybean belt in the USA having the third wettest May/June/July since 1895 it may be reasonable to think that we may end up with a yield a bit shy of that projected in yesterday’s report.
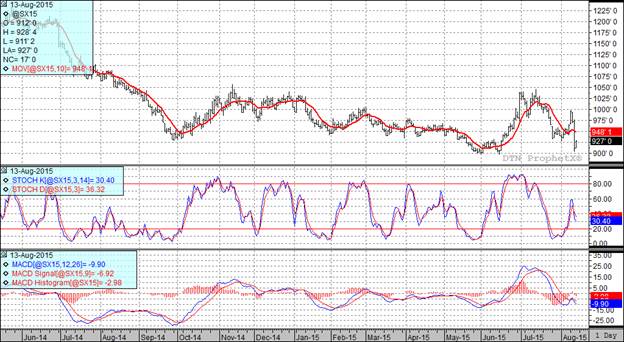
At the present time all three of my technical indicators are bearish both the September and November futures.
Wheat:
Not a great deal of news today. The weekly export sales number came in at 15.5 million bushels which is below the pace needed to hit the USDA’s annual export number. We continue to struggle to be competitive in the export market.
News out of Europe was not encouraging with Strategy Grains raising their 2015 EU wheat crop estimate to 144 MMT from the previous 140.9 MMT estimate.
At the end of the day I think wheat traded higher because the other grains were higher and it became the path of least resistance.
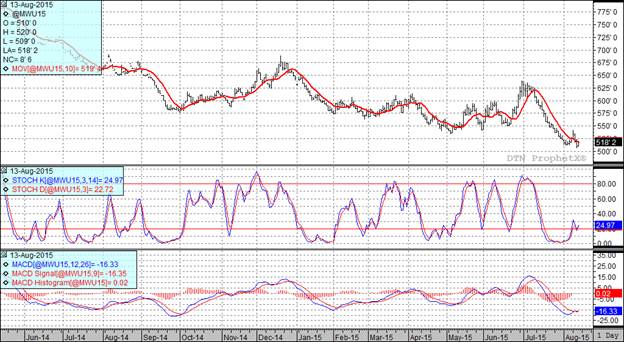
With today’s close two of my three technical indicators are bullish the Minneapolis September futures while two of three remain bearish the Kansas City September futures.
Top Trending Reads:
Topics: Grain Markets
%MCEPASTEBIN%


