Craig's Closing Comments
Lynn Miller
August 17th, 2015
Numbers, Numbers and more numbers…. But, do they mean anything to the market?
Corn:
- Export inspections were reported at 890,083 MT vs 801 last week and within estimates.
- Corn conditions were down 1% tonight at 69% good to excellent.
- ProFarmer tour is under way. Numbers in OH were slightly concerning compared to the USDA with Northwestern OH and Northeastern IN averaging 120.4
- Prevent plan acres reported at 2.3 million with most acres lost in Missouri and Mississpi.
Some ProFarmer reports talk of loss of Nitrogen, wet areas that are now dry, poor pollination and wildly variable ear sizes.
Talk of good weekly weather and carryout fear of the USDA’s 168.8 yield added pressure to prices while thoughts ProFarmers lowere numbers might be right added support. Funds were sellers of 3,000 corn contract. They are estimated long 100,000 contracts.
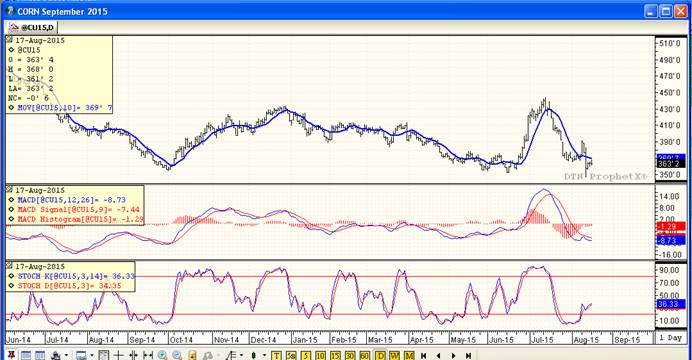
Technically, 2 of 3 indicators remain bearish the nearby September futures. The only bullish indicator right now are the stochastics; however, we are approaching the 10-day moving average and the MACD is wanting to come together. So maybe, just maybe continued information from Pro Farmer will give the trade some ideas. I would be looking to make old crop sales at $3.80, $3.90 and $4.05. Don’t set your sights too high, the September futures expire at the end of next week.

Soybeans:
- FSA prevent plant acres out at 2.1 million, significantly larger than USDA’s 800,000, Has many confused.
- NOPA Crush numbers were huge at 145.2 – largest July number on record. Has many scrambling in buy the rumor, sell the fact fashion
- Exports were 14 million bushels vs 2 last year.
- Soybean conditions unchanged from last week at 63% good to excellent
- ProFarmer reports were mixed with good pod counts in the west and mixed in the east.
The 2.17 milllion acres of prevent plant is the highest ever in the past 8 years. Usually prevent plant acres tend to migrate higher as futher paperwork is processed. World demand for Western Hemisphere soybeans have not dropped back, just the US has been put on hold. Chinese hog margins are down this week, but still in the record setting category implying they could be importing hogs or there should be higher feed demand.
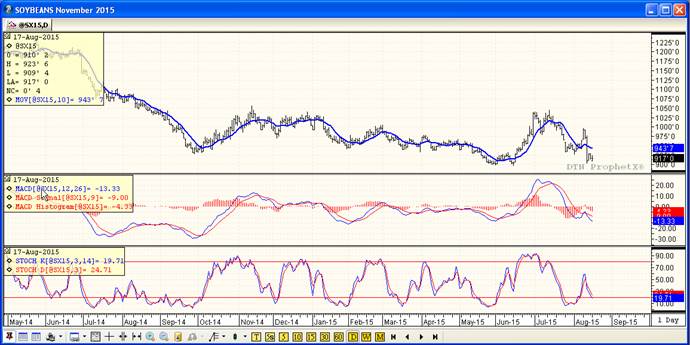
Technically all three indicators are bearish for beans. Look for support at $9.02 with selling targets step as not to miss anything on the way up: $9.35, $9.55, $9.75 and $9.90.

Wheat:
World supply continues to push values lower trying to spur some kind of demand. Lower European Union export prices and talk of higher supply pushed EU prices to a 2-month low and drug US prices with them. Funds were sellers of 4,000 contracts on the day and estimated net short 12,000 contracts overall. FSA acreage data revealed this morning leaves us to assume that the FSA is not done entering acres under the farm program. SRW is being devalued bringing only 95% of corn price vs. the norm of 110%. Feed demand is expected to rise in the OH/IN areas as a corn deficit is still a real possibility in that area.
Weekly inspections were a touch above expectations, but don’t offer any inspiration to the wheat markets. The hard wheat cash markets continue to show signs of stabilizing with help from the continued break in futures. Spring wheat ratings remain at 70% G/Ex, which shouldn’t catch anyone of guard. Spring wheat harvest is estimated at 53%, which compares to 15% LY and 31% for the 5 year average.
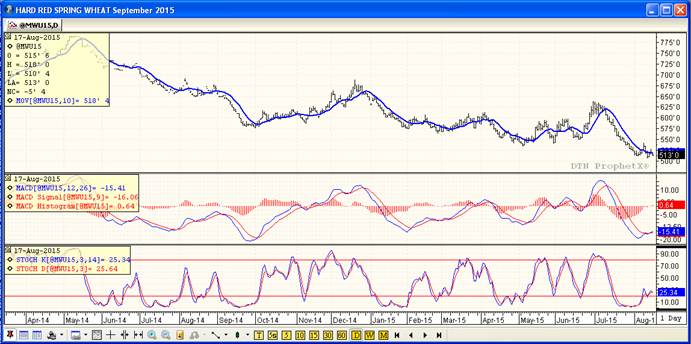
Technically, 2 of 3 indicators are once again bearish the September Minneapolis futures. The MACD remains bullish as of today’s close. If I was holding on to wheat I would be looking for $5.35, $5.55 and $5.70 as selling opportunities.
This data and these comments are provided for information purposes only and are not intended to be used for specific trading strategies. Commodity trading is risky and North Central Farmers Elevator and their affiliates assume no liability for the use of any information contained herein. Although all information is believed to be reliable, we cannot guarantee its accuracy and completeness. Past financial results are not necessarily indicative of future performance. Any examples given are strictly hypothetical and no representation is being made that any person will or is likely to achieve profits or losses similar to those examples.
Top Trending Reads:
Topics: Grain Markets
%MCEPASTEBIN%


