Craig’s Closing Comments
September 11, 2015

Fourteen years ago today our nation was attacked by followers of Islam. When I look around the world today I see ISIS on the march and our own government rolling over and opening the door for Iran to develop nuclear weapons at the same time Iran is holding “Death to America” rallies. I fear that the memory of 9/11 is already fading and that we are blind to the dangers that remain. Here is hoping that America awakes from its slumber before it is too late.
Corn:
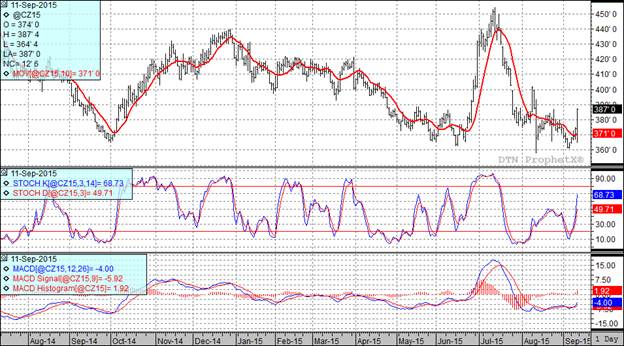
Things got interesting in the market on the heels off the release of the September USDA report this morning. Let’s walk through it step by step starting with the 2014-15 carryout. We saw the carryout reduced by 40 million bushels from last month with increase usage of 25 million more bushels of exports and an additional 15 million bushels of usage in the food, seed and industrial category. That has the effect of reducing the carry-in for the 2015-16 supply & demand sheet by 40 million bushels. With that stage set let’s move to the projected production numbers. Coming in the average trade guess was that we would see the national average yield come in at 167.6 bu/acre, down from the 168.8 posted in last month’s report. The trade was somewhat surprised by the projected yield of 167.4 bu/acre. It was interesting to see numbers reduced in the Western Corn Belt where the conventional wisdom had been the yields in that part of the world would not be backing down. In today’s report the USDA lowered Iowa 2 bu/acre to 181 bu/acre, Nebraska dropped 3 bu/acre to 184, SD down 1 bu/acre to 159/acre, and Minnesota dropped 1 bu/acre to 183. With today’s reduction I think it is a pretty safe bet to assume that traders will start imagining a small yield in corn in the October report as well. Roughly 40% of the time when yields drop between the August and September reports yields head lower between the September and October reports as well. Today’s reduced yield resulted in the total production for this crop being pegged at 13.585 billion bushels with the 2015-16 carryout projected to be 1.592 billion bushels, down from 1.713 billion in the August report. A carry-out at that level should give us a shot at trading the December futures over $4.00 at some point between now and contract expiration.
All three of my technical indicators are currently bullish the December corn futures. Today’s price action put in an outside day higher on the bar chart which should give us a pretty good shot at moving higher from here.

Soybean:
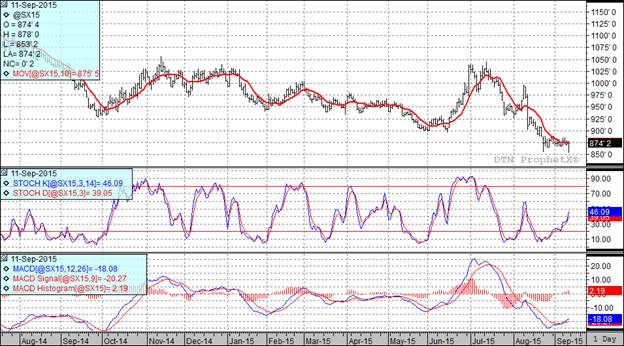
While the corn news was friendly, the news for the beans was not so positive. We did see the projected 2014-15 carryout get reduced by 30 million bushels but that was the end of the bullish news. Traders had been expecting that we would see the national average yield reduced in this report. The average trade guess was that it would be at 46.4 bu/acre, down from 46.9 bu/acre in the August report. Instead, the USDA increased the projected national average yield to 47.1 bu/acre and we saw the market tumble sharply as that news hit the market. The net result of the increased yield projection was to take the total production number to 3.935 billion bushels, giving us a projected 2015-16 carryout of 450 million bushels.
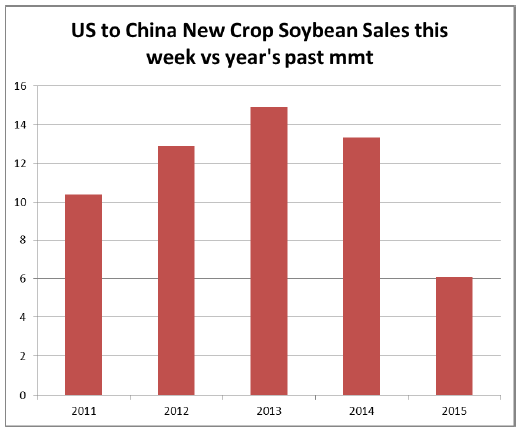
We did have some good news in the bean complex today with very good weekly export numbers. Export sales came in at 65.8 million bushels, above the top end of the trade estimates. One thing to keep an eye on is the Chinese business. So far we have not gotten the amount of business on the books with them that we have historically had at this point on the calendar. If that doesn’t change it could negatively impact prices.

Two of my three technical indicators are bullish the November futures.

Wheat:
The world is awash in wheat. Domestically, today’s report saw the projected 2015-16 carryout move from 850 million bushels last month to 875 million bushels this month. The trade had been looking for the USDA to come in at 865 million bushels. On the international front today’s report saw the 2014-15 world carryout move from 209.66 MMT in the August report to 211.3 MMT in today’s report. Moving forward the stockpile only seems to grow with the 2015-16 carryout now projected to come in at 226.6 MMT, up from a projected 221.47 MMT last month.
Weekly export sales came in at 10.7 million bushels. This was at the low end of trade expectations and was deemed as very disappointing. Wheat did post a nicely higher close today as it hitched a ride on corn’s coattails.
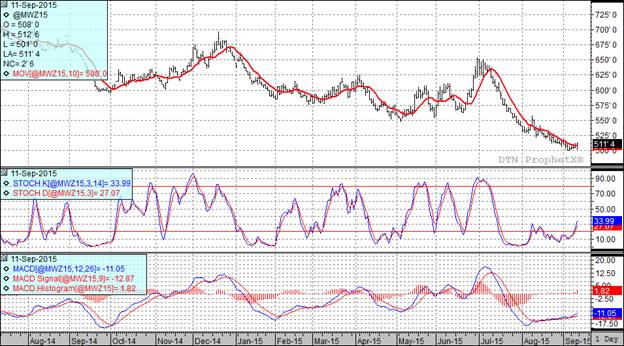
All three of my technical indicators are bullish both the Minneapolis and Kansas City December futures. Applying my Fibonacci voodoo to this market I would say that the Minneapolis December futures should be sold if they get to $5.21. If they take out that level then$5.35 is a possibility but at that level I will be mortgaging the house and selling the snot out of that market. Much of the previous sentence was hyperbole but the underlying message that this would be a great sale in what will probably be a struggling market still stands.

Top Trending Reads:
Topics: Grain Markets
%MCEPASTEBIN%


