Closing Comments
Craig Haugaard
May 15, 2015
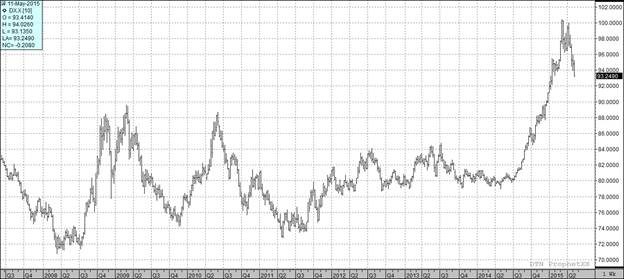
I hadn’t run the dollar chart for a while but with the recent break in that market I thought it was time to do so. As you probably know we tend to see an inverse relationship between the dollar and grain prices so if the dollar continues to trade lower it should be good for export sales and ultimately result of a firming up of commodity prices.
Corn:
We have had a few interesting reports over the past couple of days.
Yesterday was the weekly export sales report which pegged old crop sales at 14.6 million bushels. After the previous three weeks in which the weekly export numbers had exceeded the top end of trade guesses this was a disappointing number, coming in at the low end of expectations.
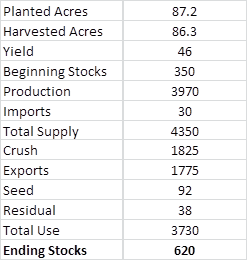
Yesterday also brought us the Informa report which pegged total corn planted acres at 88.7 million. This is down 462,000 acres from their last estimate and compares to the current USDA number of 89.2 million acres. The following table left the USDA number unchanged from the May 12th USDA report with the exception of adjusting the planted and harvested acres to reflect the Informa numbers. As you can see, this scenario drops the carry-out down to 1.66 billion bushels. If we plug in a national average yield of 158 instead of the 166.8 the USDA is using we suddenly are looking at a 2015/16 carry-out of 948 million bushels and things would suddenly get very interesting. I continue to believe that the next month or so could make the rollercoaster at Valley Fair look tame.
While we were looking at the Informa numbers and playing math games with potential outcomes in the USA I see that Strategie Grains lowered their EU corn production by 600 TMT to 67.5 MMT. This reduction was mainly attributed to reduced acres.
Heading into next week it is expected that Monday’s crop progress report will show that roughly 85% of the corn crop has been planted. That would be up 10% over last week.
In terms of weather problems I am hearing a few traders talk about frost concerns in the northwestern Corn Belt next week. I am not an agronomist but I did stay in a Holiday Inn Express last night so I think that with the corn plants in the early stages of development a frost could give us some damage and a potential pop in prices.
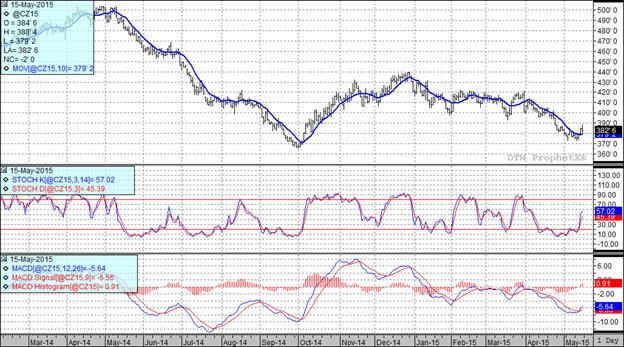
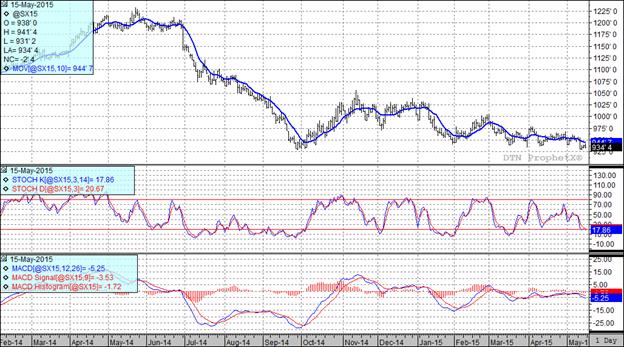
At the present time all three of my technical indicators are bullish both the July and December corn futures.
Soybean:
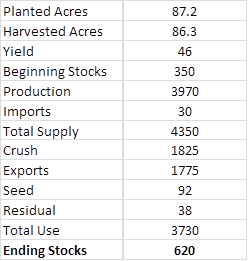
I think the biggest news I have seen the past couple of days was the Informa acreage estimate. They are now pegging planted acres for this year at 87.2 million acres. This was a huge 2.6 million acres more than what the USDA is currently using and could have huge implications on prices if this proves to be an accurate number. In the following table I adjust the USDA’s May 12 table to reflect the Informa numbers for planted and harvested acres while leaving the rest of the assumptions unchanged, as you can see it increases the projected carry-out by an additional 120 million bushels and has incredibly bearish implications for the new crop futures.
Of course, it must be noted that we don’t have those acres planted yet and if it keeps raining I suppose some of the acres may drop off. Speaking of planted acres, when Monday’s Planting Progress Report comes out the trade is looking for it to reflect that 40 to 50% of the beans have been planted. Last Monday planted acres stood at 31% complete.
The demand side of the picture has been pretty solid. Yesterday’s weekly export sales came in at 5.02 million bushels. That was on the low end of expectations but it needs to be noted that we have already exceeded the USDA’s annual export projections number so unless we start seeing a lot of cancellations we will eventually have to see the USDA increase their export number.
In terms of domestic demand we had the monthly NOPA numbers out today. Coming into this year the all-time record crush for April was 139.966 million bushels back in April of 2008. The average trade guess was that we would see a crush number of 147.827 million bushels but we blew that away with today’s announced number coming in at 150.363 million bushels. A new record for the month of April by roughly 10.4 million bushels. Of course the market went down on this news so I suppose we should be very thankful we didn’t get bearish news in this report. A year ago we crushed 132.67 million bushels in the month of April.
Not all is rosy in the world of soybean demand as the bird flu continues to impact poultry demand. Today Nebraska’s Governor declared a state of emergency after federal official confirmed a second case of avian flu. Thus far we have 162 confirmed cases of bird flu with over 33 million birds being affected.
South America is pretty much wrapped up for the year but I see that the Rosario Grains Exchange is now projecting total Argentine soybean production for the 2014/15 crop will be 59.6 MMT, up from their prior estimate of 59 MMT. They are also reporting that 79.5% of the bean crop in Argentina has been harvested. That compares to 67% harvested at this point last year.
At the present time all three of my technical indicators are bearish both the July and November soybean futures.
Wheat:
Wheat took center stage yesterday as rumors of a frost in the western half of Nebraska and Kansas around the middle of next week drove the market sharply higher. Frost wasn’t the only weather story as we continue to hear about potential flooding problems in Texas and Oklahoma with forecasts calling for continued excessive moisture over the next 7 days.
We also had the weekly export sales numbers out yesterday and at 4.2 million bushels they were on the lower end of expectations. With the marketing year about wrapped up total commitments are currently at 99% of the USDA’s projected annual exports number.
From an international perspective we had mentioned El Nino earlier this week and now I see that GrainCorp is expecting 2015/16 grain production along Australia’s east coast to total just 16.3 MMT due to dry conditions. This is down 1.1 MMT from last year and significantly lower than the historic average of 20 MMT. This is also in keeping with the dry conditions that we expect to impact Australia in an El Nino year.
The tough growing conditions are not a worldwide phenomenon with Strategie Grains increased their 2015 EU soft wheat crop 1.2 MMT due to favorable growing conditions; this pushes their estimate up to 42.6 MMT.
We had been expecting that today we would get an announcement from Russia on their wheat export tax. We were not disappointed as they announced that they are removing their wheat export tax. The Russian government believes will increase export sales by 1 MMT. A new tax is expected to be introduced on July 1st that is calculated with a different formula. The net result is probably that they will be even more competitive in the export market.
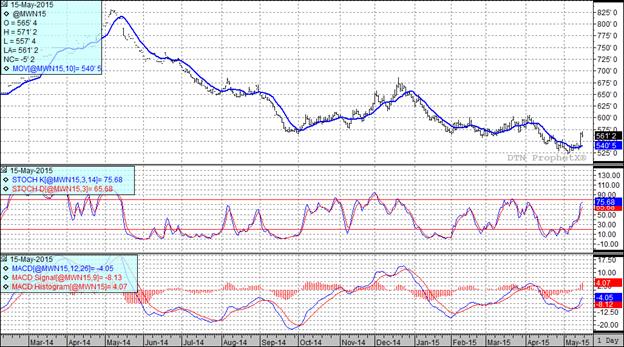
All three of my technical indicators remain bullish both the Minneapolis and Kansas City July futures.
Top Trending Reads:


