Closing Comments
Lynn A. Miller
May 19, 2015
Corn:
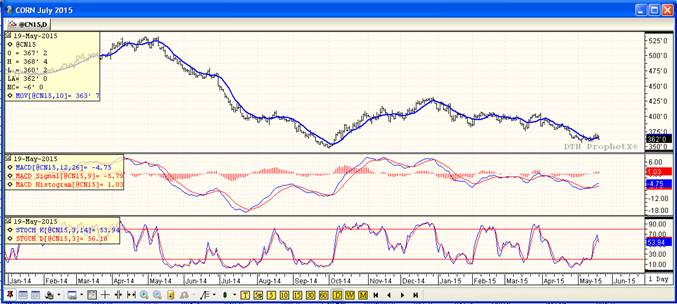
Export inspections released this morning continue to be strong at 44 million bushels vs. 42 last year. Other than that, there was a lot of not so supportive news and thoughts on the horizon today that helped the rising dollar bring corn down. The July contract rejected a double top at 3.71 and ended the day lower instead. Factors all parties are watching:
Planting Pace – 85% complete vs 75 average. Estimates are done by Memorial Day.
Weather – good moisture, normal temps, early planting is a recipe for big crops.
Crop Rating – some expect the entire US crop to be rated a record 81% good-excellent
Basis Levels – improved farmer selling is pressuring basis.
Ethanol – Yields are improving. Margins at $0.25-0.30 per gallon
Technically 2 of 3 indicators are once again bearish with today’s price action falling below the moving average. The stocastics are also issuing a sell signal while the MACD remains supportive. Look for support at $3.56 with the first level of resistance at $3.74.

Soybeans:
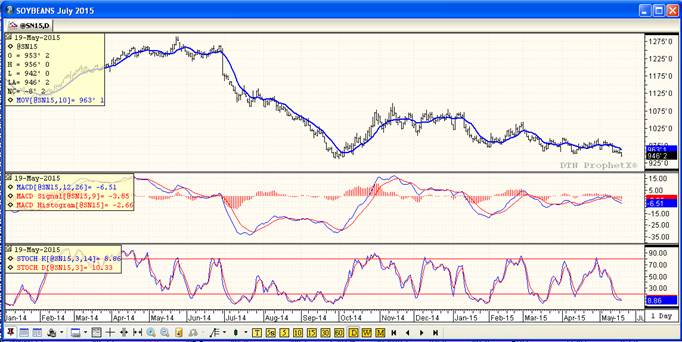
Beans can’t seem to buy a break either, falling today with wheat and corn on the heels of a higher dollar. Looking away from the dollar there are a lot of other negative factors at play in this market. The estimate 45% of the US bean crop is planted vs. 36 on average. Some private analysts are shooting out acre numbers closer to 87 million vs. the USDA’s 84.6. This alone could raise the carry out another 130 million bushels – to 630. That’s a big number. And more beans = lower prices. I would not be surprised to see this new crop market trade below $9.00 this year after putting in a new contract low today.
Exports remain good for this time of year coming in at 12 million bushels this morning vs. 6 last year. Year to date we have already loaded 1,711 vs 1,538 last year.
Technically, all three indicators remain bearish at the present time for both old and new crop beans. In the July, we closed at $9.46, just off of support of $9.35 – the10/1/14 contract low. This is scary to me and makes a technical recovery to $9.00 cash beans seem pretty tough.
If you are still sitting on beans first level of resistance sits at $9.79.

Wheat:
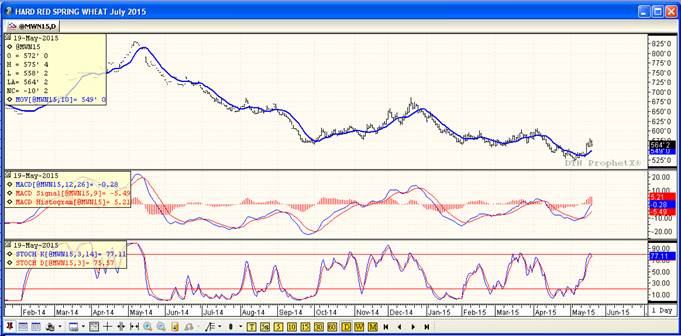
Well, what can I say, it didn’t freeze overnight like most forecasters had predicted. Therefore, we are lower today as the short-covering frenzy came to an end. At least that is part of the equation. Yesterday traders were happy to jump on a weather scare and run us up into major resistance territory. Producer selling was much slower today than yesterday.
Export inspections came in at 11 million bushels vs. 22 last year. Overall for the year we have loaded 799 million against the USDA’s goal of 860. With only 2 weeks left in the marketing year we will fall short.
Technically, all three indicators remain bullish the Minneapolis while 2 or 3 are bullish the Kansas City. Trade action of the past three days is establishing a support line at $5.60 while we are watching resistance at $5.84.


Top Trending Reads:


