Craig’s Closing Comments
May 29, 2015
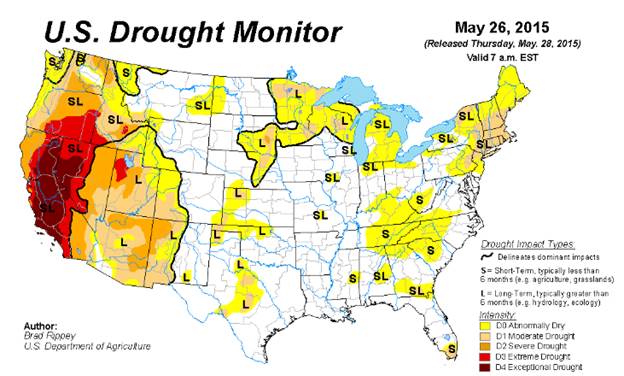
It doesn’t seem that long ago we were all worried about drought and I was running the drought map on a weekly basis. That is obviously no longer a concern but I thought to illustrate how much has changed I would run the latest drought monitor map. As you can see, the entire Corn Belt is in pretty good shape right now and with favorable weather forecast to continue the path of least resistance will probably continue to be lower in all the grains.
Corn:
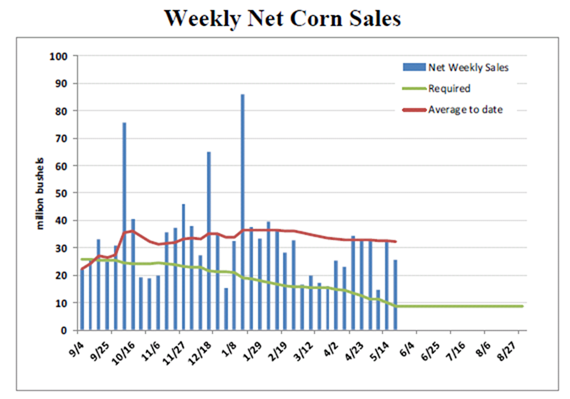
Weekly corn exports came in at 25.9 million bushels which was right in the middle of the trade guesses. In other words, kind of a yawner of a report.
That was followed up with another yawner when the EPA biofuel blending targets came out right where expected. We will still be using roughly 5 billion bushels per year to produce ethanol and if that number is to grow it will have to be because of ethanol exports not domestic use. While in line with trade expectations it was disappointing with the best comment I saw coming from Tom Buis, CEO of the ethanol industry group Growth Energy, who remarked “The initial read on EPA’s proposal is they have simply acquiesced to the demands of Big Oil.”
With no real bullish news the path of resistance was lower today. We saw the funds join that crowd as they were sellers of 3,000 contracts on the day.
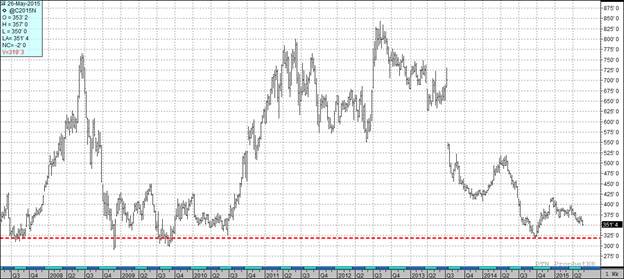
At the present time two of my three technical indicators are bearish both the July and December corn futures. Looking at the weekly chart I find myself wondering if we could trade down to the $3.19 area in the spot futures. That level is indicated on the following chart by the red line.
Soybean:
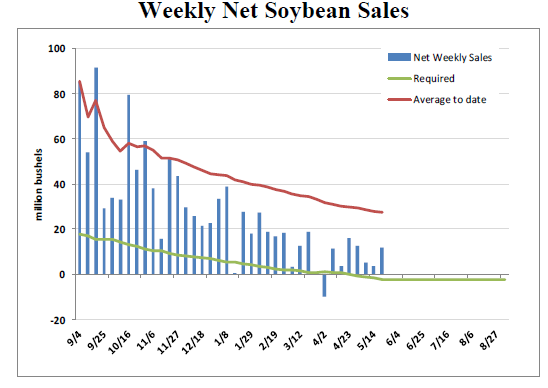
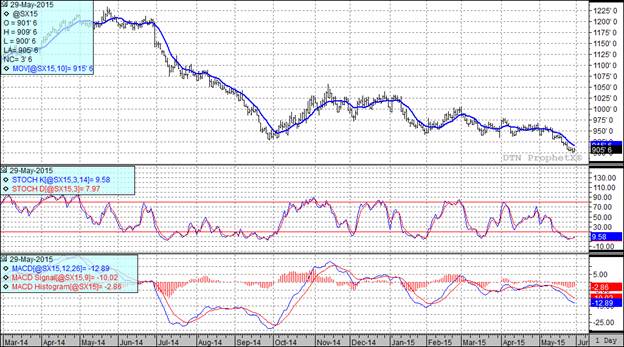
For yet another week we saw soybean exports come in above the top end of trade guesses. This week’s sales of 11.85 million bushels pushes the total commitments for the year to 1.836 billion bushels. This is 36 million more bushels than the USDA is projecting for the entire year so we either need to start seeing net cancellations or else the USDA will have to increase their annual projected exports number.
While the EPA report was a non-event for corn it was seen as bullish for soybeans. The EPA pegged the biodiesel mandate at 1.7 billion gallons for 2015 and 1.8 billion gallons for 2016. That got a good bullish reaction from the market but if I did my math correctly it only represents about 10.9 million more bushels of demand than what the trade was looking for so today kind of felt like an over-reaction. As I mentioned earlier this week, the market is really oversold and in need of a bounce. Today’s news coupled with month end activity gave the market a reason to bounce today but I will be surprised if it is more than just a dead cat bounce.
At the present time two of my three technical indicators are bearish both the July and November soybean futures.
Wheat:
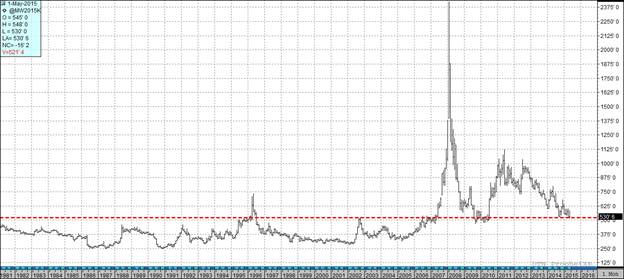
Is wheat cheap? If you look at the following continuation chart you could certainly argue that we are near or at some significant long term support. Of course, if the support doesn’t hold this thing could go down like a submarine with screen doors.
Today it certainly didn’t seem like we were anywhere near the bottom of this market as the trade seemed more concerned about our lack of competitiveness against the cheaper wheat being offered by the rest of the world. Worldwide wheat supplies are abundant and are being offered cheaper than USA wheat. At the end of the day the USA crop may be smaller than current estimates but, we are going to get a crop and that crop is coming to market at a time when USA wheat is not competitive in the export market or in the domestic feed market. That tough reality may keep wheat prices heading lower.
An extremely rough day in this market has all three of my technical indicators bearish both the Minneapolis and Kansas City July and September futures.
Top Trending Reads:
- S.D. farmboy turned investment banker creates farm management program
- Farm Software: 5 Tools Every Farmer Should Be Using
- How To Determine If Commodity Prices Are Too Low To Market Grain
- Using Futures Options In Grain Marketing

Top Trending Reads:


