Craig’s Closing Comments
Craig Haugaard
June 4, 2015
Corn:
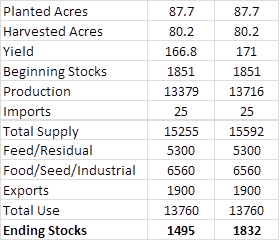
A story that has been making the rounds is that due to the planting delays we could see 1.5 million less planted acres than what the USDA has been projecting. With planted acres already diminished this has given support to the bulls amongst us. While that may very well turn out to be true it is also true that the 6 to 10 day forecast looks very good for early crop development. The majority of the Corn Belt is forecast to experience normal to above normal temperatures with the eastern Corn Belt also pegged to receive above normal precipitation. Just out of curiosity I took the recent USDA report and reduced both the planted and harvested acres by a million and a half to generate the following table. The second column is the same numbers with last year’s national average yield plugged in instead of the current USDA projected yield.
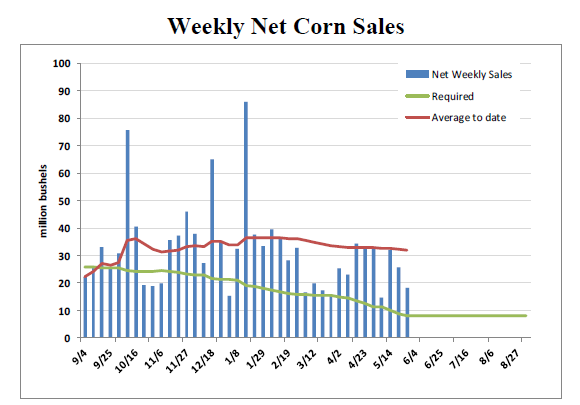
The weekly export sales report was somewhat disappointing, coming in at 18.3 million bushels which was at the low end of expectations. An even bigger surprise was that new crop sales were negative with Japan and Canada cancelling existing sales. They were probably rolled back to old crop. This is the second consecutive week that we have seen cancellations in new crop. Last week it was a very small bushel amount, this week a bit larger but nothing that is going to worry the trade to much unless this trend continue for a few more weeks.
With much of the crop planted and getting off to a good start we are seeing producer selling become more active and that could ultimately place some pressure on these prices.
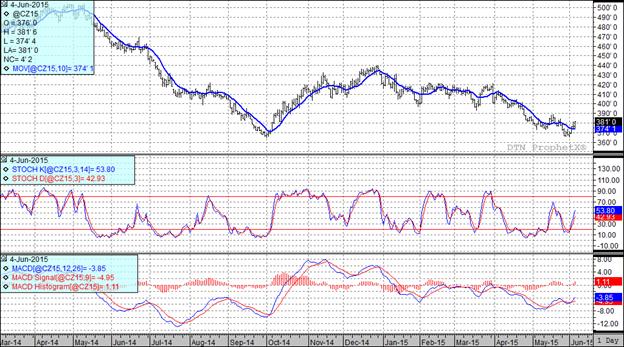
At the present time all three of my technical indicators are bullish both the July and December corn futures.
Soybean:
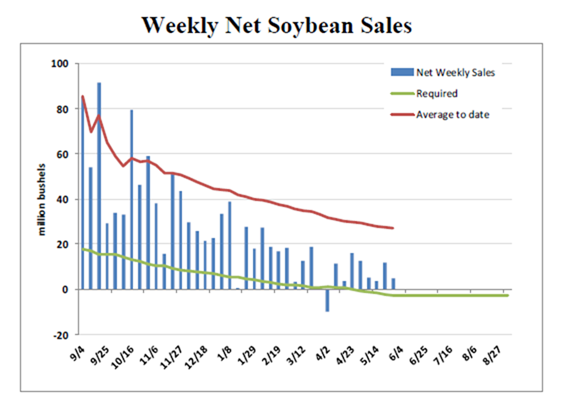
The weekly export sales report came out at 4.79 million bushels for the week. Although this is not a strong number it pushes the annual export to roughly 1.841 billion bushels. Since the USDA is projecting annual exports will come in at 1.8 billion bushels that leaves us needing to average a touch over 2.9 million bushels per week of NET CANCELLATIONS for the rest of the marketing year. I am going to go way out on the limb here and boldly predict that we will end up with exports that are larger than the USDA’s current projection.
In an export related story, we were lower in the overnight on the rumor that Chinese crushers were going to default on some contracts. As the sun rose so did spirits with a new rumor that instead of walking away from the contracts the Chinese crushers in question were going to renegotiate the contracts. That was enough to buoy the market and attract some additional fund buying. For the session the funds were buyers of roughly 7,000 contracts.
While we will see exports increase we may see a diminished demand for soybean meal. According to USDA’s chief veterinarian we in the USA have lost almost 45 million birds as a result of avian influenza. There may be light at the end of the tunnel as they are seeing a decline in the number of new cases. In a separate news release, USDA said that current vaccines aren’t effective enough against the H5N2 virus and may put our export markets in jeopardy so clearly we have some important work to do in this area.
While this rally has been a pleasant surprise to many of us at the end of the day I suspect that favorable weather conditions and bearish fundamentals will cap the rally and long term we will probably head lower. It would probably be wise to reward this rally in the not too distant future.
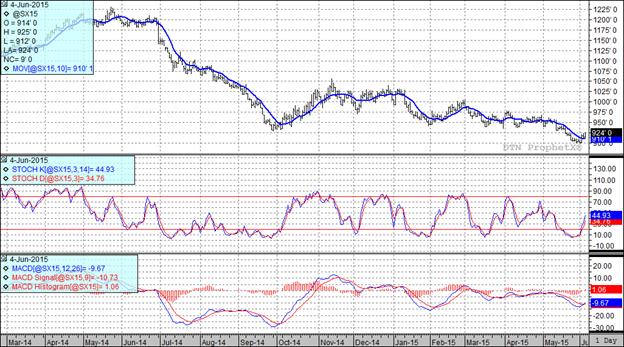
At the present time all three of my technical indicators are bullish both the July and November soybean futures.
Wheat:
Coming into the past week or so the market has been extremely short the wheat market. When a market is so heavily weighted one way or the other it is not unusual to see some pretty violent prices moves in the opposite direction and that has been the case of late in the wheat market. From a fundamental position the trade is concerned about the delay in the USA HRW harvest and the quality damage the excessive rains may be causing. An example is in Kansas where, for the first time since the 1930’s we are seeing Flag Smut. Flag Smut will hurt yields, but according to Kansas State University, does not affect quality.
We are also seeing a weather risk premium being added due to worries over dryness in Europe and Russia. Another overseas story that traders are keeping an eye on is in Germany where regulations limiting nitrogen fertilizer applications are expected to take effect later this year. This has raised concerns that it might lead to less milling quality wheat available for export from that nation.
In China we saw fewer acres of wheat planted this year but China’s Ministry of Ag expects that higher yields from good growing conditions will give them larger total production than last year; which was 4.64 billion bushels.
This seems to be the story worldwide with the U.N.’s FAO recently increasing their estimate of global wheat production by 4.3 MMT to a total world production of 723 MMT.
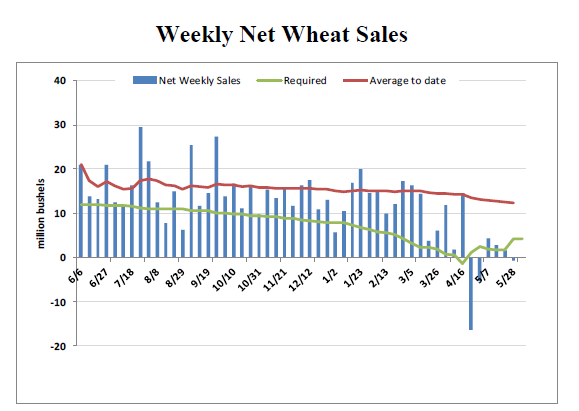
The market year for wheat ended on May 31st. Today’s weekly export sales showed net cancelations for the week on May 28th which left us about 4.25 million bushels shy of the USDA annual projection. When the smoke clears on this marketing year I would expect the actual number to come in at 855.8 million bushels versus the USDA estimate of 860 million bushels.
In spite of the rally we are enjoying I think it would be wise to remember that we are still uncompetitive in the export market and that means in all likelihood that this rally will be limited and should be seen as a selling opportunity and not the start of a new major bull move. With harvest starting to gear up in some major wheat producing areas of the world I suspect the bear is lurking nearby.
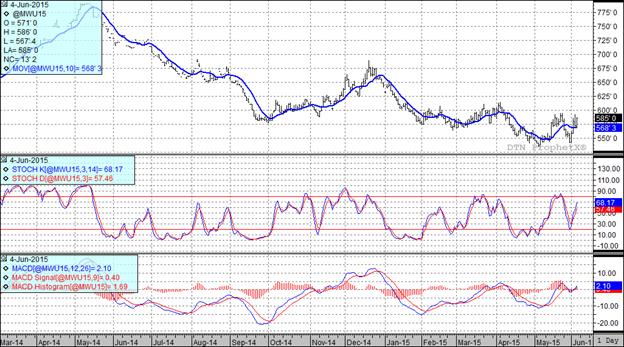
All three of my technical indicators are bullish both the Minneapolis and Kansas City July and September futures.
Top Trending Reads:
- S.D. farmboy turned investment banker creates farm management program
- Farm Software: 5 Tools Every Farmer Should Be Using
- How To Determine If Commodity Prices Are Too Low To Market Grain
- Using Futures Options In Grain Marketing

Top Trending Reads:


