Craig’s Closing Comments
Craig Haugaard
June 5, 2015
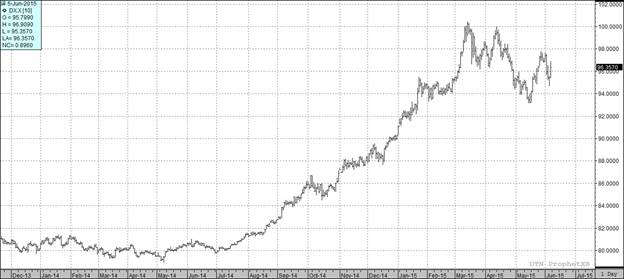
We can’t overestimate the impact of the dollar on commodity prices and for today at least it was roaring higher. This in turn put pressure on commodities straight across the board.

Corn:
The conventional wisdom is that the next two weeks will bring less rain and warmer temperatures to the Corn Belt. This should help improve corn conditions in the west and thus was seen as negative today. Having said that, the trade is looking for the crop conditions to check in at 74% good to excellent.
The optimistic weather outlook coupled with the fact that this week’s rally was seen predominantly as a short covering rally which was running out of gas pressed the market lower today. We have seen a large number of producers both in our trade area as well as across the entire Corn Belt take advantage of the rally this week and I for one am happy to see folks reward it.
While most of the focus has rightfully been on our crop and the delayed planting progress we can’t lose sight of the fact that South American crops keep getting bigger. The Buenos Aires Grain Exchange is currently pegging their corn crop at 25 MMT versus the 24.5 MMT that the USDA is projecting. They are also reporting that 39% of their corn crop has now been harvested.
Aside from good weather outlook and large foreign crops the market also found itself wrestling with a lack of demand in the form of no sales announcements this week. All of that combined with the aforementioned stronger dollar pushed the market to a lower close for the session.
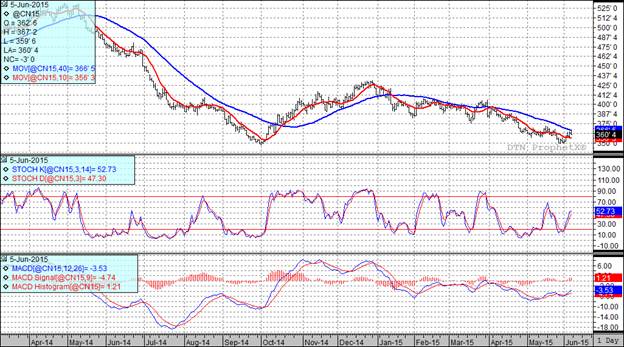
At the present time all three of my technical indicators are bullish both the July and December corn futures. I find it interesting that in both months the market moved right up against the 40 day moving average (blue line on the following chart) and then broke lower. It appears as if that price level may provide a significant resistance level.

Soybean:
The tow week outlook that I mentioned under the corn comments also weighed on bean prices today as traders felt it would open the door to get the rest of the USA bean crop planted. It is expected that Monday’s planting progress number will give us something around 71% planted.
Heading into next week’s June USDA report the average trade guess for the 2015-16 carryout is 487 million bushels with traders looking for 339 million bushels of carryover in the 2014-15 time slot. Both of those numbers are down slightly from last month’s numbers.
Soybean harvest in South America seems to be wrapping up with the Buenos Aires Grain Exchange estimating that their bean crop is 93.4% harvested. Last year at this point 80.6% of the crop had been harvested. They are also rating this crop size expectations with it now pegged at 60.8mmt. Some private analysts that have a good grip on that area are suggesting we could see the crop eventually be pegged in the 62 to 63 MMT range. At the present time the USDA has them projected to have a total bean production of 58.5 MMT.
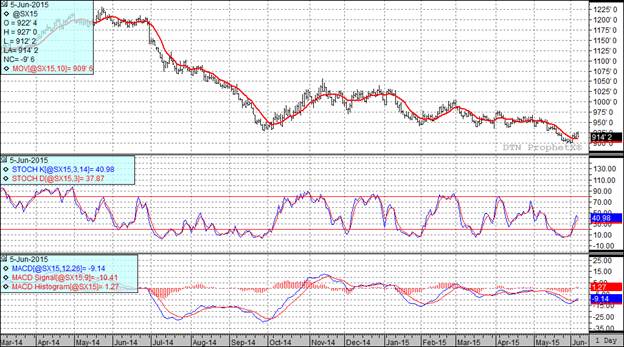
At the present time all three of my technical indicators are bullish both the July and November soybean futures.

Wheat:
Harvest in HRW country is starting to roll again with expected to progress in Oklahoma this week-end. I see that we have a chance of rain re-entering the forecast in the southern plains so they are not out of the woods yet but hopefully we can start making some good progress. One question that is yet to be answered is the extent of the damage done by the wet weather in HRW country.
Heading into next week’s USDA report the average guess for 2015 - 2016 wheat carryout is 798 million bushels. That would represent a 5 million bushel increase from last month. All wheat production is estimated at 2.110 billion bushels, up 23 million bushels over last month’s projection. When you look at a market where the trade is expecting both production and carryout to increase from last month and where we have been uncompetitive in the export market it makes this week’s solid rally a bit more difficult to understand. It also may mean that it will be short lived.
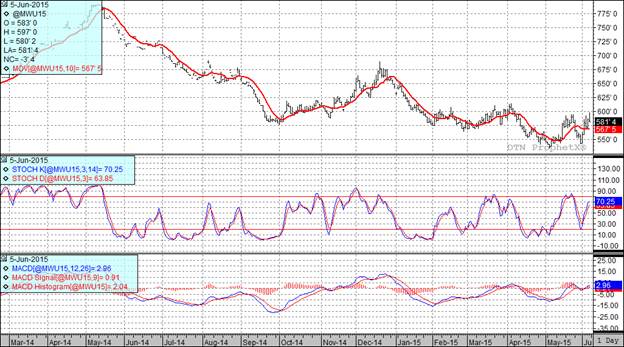
All three of my technical indicators are bullish both the Minneapolis and Kansas City July and September futures.

Top Trending Reads:
- S.D. farmboy turned investment banker creates farm management program
- Farm Software: 5 Tools Every Farmer Should Be Using
- How To Determine If Commodity Prices Are Too Low To Market Grain
- Using Futures Options In Grain Marketing

Top Trending Reads:


