Craig’s Closing Comments
Craig Haugaard
June 9, 2015
Corn:
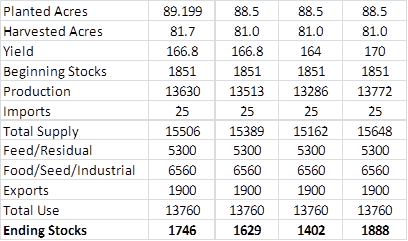
Weather seems to still be the major driver in this market with talk of acres not getting planted and conversation surrounding El Nino this year. Some of the private analysts that we visit with are suggesting that the planted acres will actually come in at 88.5 million versus the USDA’s current estimate of 89.2 million planted acres. If we plug those numbers in to the following chart we get the following carryout scenarios. The first line is the current USDA supply and demand projection. The next three lines are three different yield scenarios. I used the USDA’s 166.8, a 164 yield as suggested by some private analysts and the 170 that Dr. Elwynn Taylor is projecting. That gives us a potential carry-out that ranges from 1.402 to 1.888 billion bushels.
While the above is all interesting, what the trade is really focusing on is tomorrow’s report. Heading into that report the average guess is that we will see the new crop (2015/16) carryout swell by 33 million bushels to a total of 1.779 billion bushels. The range of estimates runs from 1.622 to 2.053 billion bushels.
In international news I find it interesting that the Chinese are becoming concerned about their growing supply of corn. Their current forecast for the end of the 2015/16 growing season is 102 MMT, up 4 MMT from last month’s estimate.
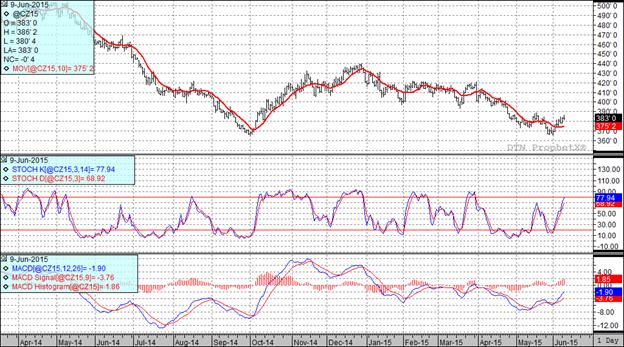
At the present time all three of my technical indicators are bullish both the July and December corn futures.
Soybean:
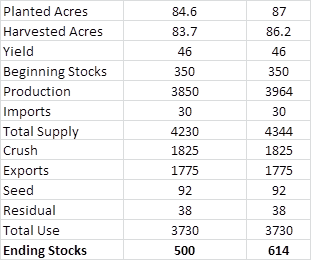
Weather concerns helped propel the bean market higher once again today. While we covered the planted acres numbers in this space yesterday it is interesting to break them down by state. The states of Kansas and Missouri are getting the most attention with 6.57 million acres of bean yet to be planted in those states. If they were on a normal planting pace we would expect that they should only have 2.66 million acres to plant. It is very interesting to note that in spite of the delay we still have two well followed private analysts projecting that planted acres will be up 2.4 million for the year. The following table uses the current USDA projection in the first column and then plugs in an extra 2.4 million acres in the second column while leaving the other assumptions unchanged. As you can see, that scenario has pretty dire consequences for prices if it turned out to be accurate.
As we head into tomorrow’s report the analyst are projecting that the 2015 - 16 carryout will decrease by 13 million bushels for the new crop to 487 million bushels. The range of guesses run from 433 million to 569 million bushels.
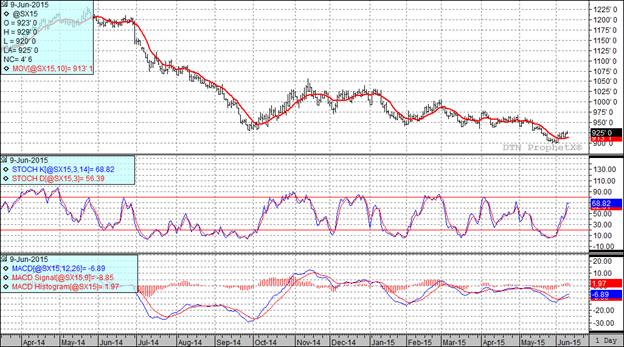
At the present time all three of my technical indicators are bullish both the July and November soybean futures.
Wheat:
Heading into tomorrow’s report the average trade guess is that the USA 2015 -16 wheat carryout will increase by 5 million bushels from 793 million bushels last month to 798 million bushels in tomorrow’s report. The range of estimates is running from 672 to 876 million bushels.
On the export front I am hearing that Russia will be cutting their minimum wheat export tax from 35 Euros per MT to 1 Euro per MT. If true that will drive more business their way. Kind of hand in hand with that story I am seeing private analysts suggesting that Russia’s wheat crop will be well above the 53.5 MMT that the USDA is currently estimating. Of course, weather is still key to that and right now I am seeing concerns over dryness coming out of western Russia and southern Europe as well as Canada.
On the world scene the average trade guess is that we will see world ending stocks projected at 201.7 MMT, down 1.6 MMT from last month’s estimates but still an ample supply of wheat.
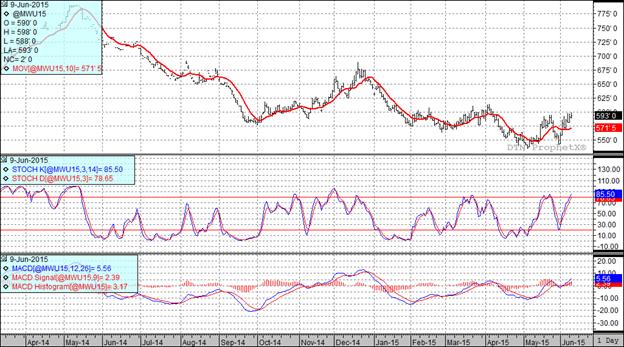
All three of my technical indicators are bullish both the Minneapolis and Kansas City July and September futures.
Top Trending Reads:
- S.D. farmboy turned investment banker creates farm management program
- Farm Software: 5 Tools Every Farmer Should Be Using
- How To Determine If Commodity Prices Are Too Low To Market Grain
- Using Futures Options In Grain Marketing

Top Trending Reads:


