Craig’s Closing Comments
Lynn Miller
June 10, 2015
Corn:
First order of business this morning was the weekly ethanol numbers. Total crush this week was an astounding 104.16 million bushels. Stocks were only up slightly proving that American’s are driving with the summer season and lower gas prices than the past few years. This number brings the bushels needed/week to meet the USDA estimate down to 101.185, still a big number.
The big order of the day was the USDA report. And you know, there was nothing spectacular in it either way.
14/15 US Carryout was increased to 1876 vs last month’s 1851.
15/16 US carryout was increased to 1771 vs 1746 in May (Avg trade guess was 1779)
14/15 World carryout was increased to 195.2 vs 191.9 in May
When you look at the total picture – 89.2 million planted acres, 166.8 bu/acre yield and a carry-in of 1171 million bushels we get a stocks to use of 13%. A relatively high number for the US vs. the 7% we saw in 12/13. This would suggest some price pressure like we are seeing.
Funds were net sellers of 14,000 contracts today as they add to their already short position.
We are hearing some estimates that planted acres could be closer to 88.5 vs the 89.2. Concerns that the wet start to this crop is bringing down final yield are also being heard. Lower yields and less acres would me a lower stocks to use and could be price supportive. Keep an eye on the weather – it will be the key.
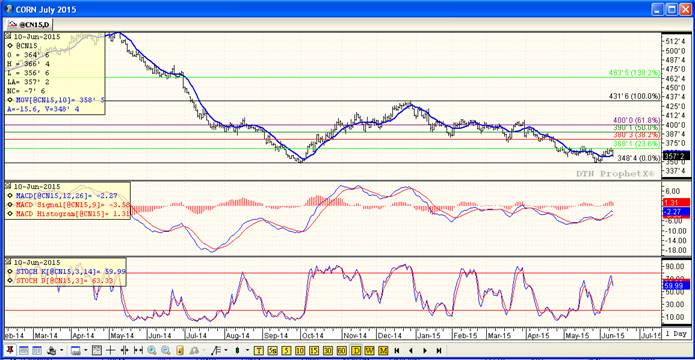
Technically 2 of 3 indicators have turned bullish with today’s price action. We have fallen through the 10-day moving average and the stochastics are signaling to sell. We should see some pretty solid support at $3.48 since we have tested that level now twice. If looking to price old crop bushels still I would be looking for $3.68 and $3.80 respectively.
In the new crop, 2 of 3 indicators continue to be bullish with only the stochastics in sell mode. We ended the day right at the 10-day moving average making the technical a little shaky. If you are looking to make New Crop sales my target levels would be $3.83 and $3.94.

Soybeans:
There was nothing to spectacular from the USDA in the line of beans today. The USDA did reduce the old crop carryout from 350 to 330 million bushels. And decreased new crop carry out to 475. Continued good demand for US beans in affecting both new and old crop balance sheets as increased sales this year drop next year’s carry-in. Both numbers were supportive of beans and they tried to stay positive, but as corn and wheat weakened beans had a tough time fighting.
Looking at the balance of the crop year, a lot of private crop watchers have been anticipated planted acres closer to 87 million vs the USDAs 84.6. The wet spring and planting delays may reduce final acres somewhere near 85.5. The increased acres would be price negative for the bean complex. All these numbers really mean increased bushels and therefore an increased stocks/use. With the number the USDA gave us today, we could see a stocks/use ratio next year of 13.4% - the largest ever. A lot of followers still feel that beans are $1.00/bu overpriced.
One thing of interest today as we talk about focus shifting to the weather was Japanese weather forecasters, who went on record to say the current El Nino pattern could last through the winter and be worse than 2009. This would mean drought in Asia and near perfect conditions in S. American. The Beunos Aries Grain Exchange is predicting another year of record bean production at 66 mmt vs. this years 60.8.
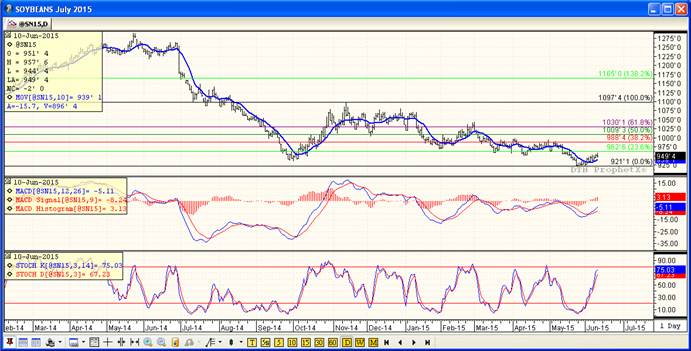
Technically all three indicators remain bullish the nearby beans with the stochastics approaching over-bought territory. Support sits at $9.21 should we set back alittle, but I would be looking more to make sales at the top of this move with orders at $9.62 and $9.88.
As for the New Crop all three indicators are also bullish with price targets at $9.35 and $9.58.

Wheat:
The USDA numbers were the hardest on the wheat markets today. They increased 14/15 stocks by 3 million bushels to 712 vs 709 last month. Then they increase Winter Wheat production by 33 million bushels, raising all wheats 10 million to 814 for the 15/16 crop year.
Heavy rains across the southern plains and south east has increased winter production ther 1.505 billion bushels; however, quality concerns continue. From here on out we need to pay attention to Canada, Southern European Union and Western Russia. These areas are all needing rains and weather will play a role.
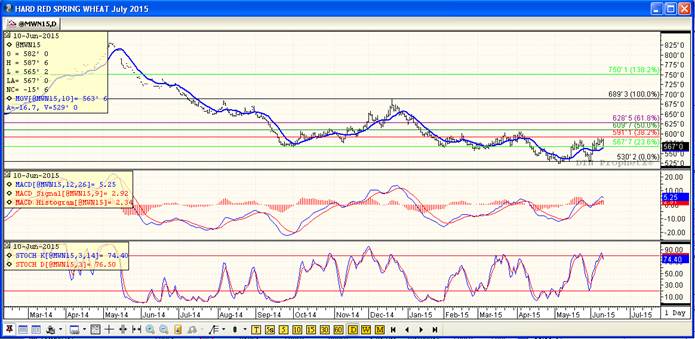
Technically 2 of 3 indicators remain bullish after today’s price action with only the stochastic issuing a sell signal. The MACD is turning however, so if we can’t find some support quick like we could see it set back with $5.67 our first line of support. Should we continue to rally I would be looking to make sales at $5.90 and $6.09.

Top Trending Reads:
- S.D. farmboy turned investment banker creates farm management program
- Farm Software: 5 Tools Every Farmer Should Be Using
- How To Determine If Commodity Prices Are Too Low To Market Grain
- Using Futures Options In Grain Marketing

Top Trending Reads:


