Craig’s Closing Comments
Craig Haugaard
June 15th, 2015
Late last week and over the week-end I took a road trip that gave me an opportunity to see a lot of the Corn Belt. I left Thursday morning and drove to Sioux Falls and then on I 90 across southern MN, Wisconsin and on into Chicago. From Chicago I headed south to Terre Haute, IN and then pointed it west, taking I 74 across Illinois and I 80 across Iowa. From there I popped on to I 29 just north of Omaha and headed back to Aberdeen. I have to tell you that I came back more bearish then when I left. While I did see drowned out spots in places the crop for the most part looks phenomenal. I thought maybe I would see yellow corn as a result of all the moisture leaching away nitrogen but I actually saw very little of that. The areas I covered seemed to have good color and be off to a great start. I will be the first one to admit that driving the interstates of this great nation is a poor way to judge the crops but if what I saw through my windshield is anywhere close to reality we have the potential for a big crop this fall. Earlier today I did visit with a friend in Indiana who works with the plots that DeKalb has in that state and he told me that so far the crops are looking as good as they did last year. I know that at these price levels it is hard to believe prices can go much later but if this crop comes through we may be surprised at how much lower we are trading by harvest time this fall.
Corn:
Corn traded lower on the good weather conditions that the developing corn crop is enjoying.
The weekly export inspection numbers were out this morning and at 43.3 million bushels they were actually a little stronger than the top end of trade expectations. As has been the case in recent days, the stronger than expected inspections did not translate into a stronger price environment.
After the close we had the weekly crop conditions report which showed the crop slipping from 74% good to excellent last week to 73% in that category this week. A year ago 76% of the crop was rated as good to excellent. It will be interesting to see if that little bit of slippage emboldens the bulls at all. With a new contract low being made in the December corn futures today the path of least resistance for now still seems to be to the downside. The other number we were given for corn today was the % of corn emerged, that stands at 97% which is slightly better than the five year average of 95% emerged on this date.
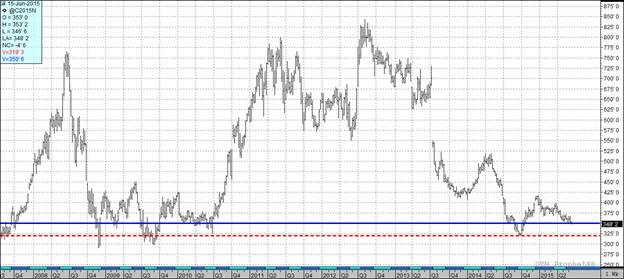
At the present time all three of my technical indicators are bearish both the July and December corn futures. Looking at the spot weekly chart you can make the argument that we are in an area that could provide some support. One could also look at this chart and deduce that if this level gives way we could easily drop another $0.30 before finding another level of significant support.

Soybean:
We handed this market some pretty good news today but got a fairly disappointing reaction in response to it.
The weekly export inspections came out at 8.3 million bushels which was above the top end of the range of trade guesses. This report was followed a couple of hours later by the monthly NOPA crush report. The trade was expecting that roughly 147 million bushels of beans were crushed domestically last month so the actual number of 148.4 million bushels caught most traders by surprise. This was down slightly from the April crush of 150.4 million bushels but well ahead of last May’s number of 128.8 million bushels. In fact this was the largest number of beans ever crushed in the month of May in the history of the USA. Having said all of that it was good for about a two cent bump. So why did we fail to get more of a bullish reaction? I suppose it is because the soybean oil stocks swelled from 1.441 billion pounds in April to 1.578 billion pounds in May. It is also worth noting that meal exports in May totaled 51,146 tons versus 799,315 tons in April and 465,301 tons a year ago.
After the close we received the crop conditions report which showed good planting progress as well as a solid condition picture. The bean crop was reported as 87% planted. The trade was expecting to see 82% of the crop planted so that number could be viewed as negative. The five year average is 90% planted by this date. While planting was going a little better than the trade expected we did see the crop condition unexpectedly slip. Today the crop was rated at 67% good to excellent. That is down 2% from last week as well as being inferior to the 73% posted on this week last year.
At the end of the day we are basically trading weather on with the general consensus favoring a big crop we saw the November contract make a new low of $8.95 ¾ before bouncing back and closing at $9.04 ¼.
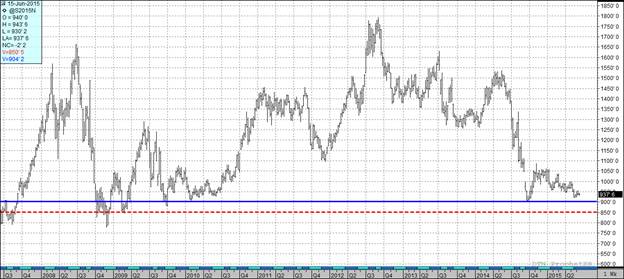
At the present time two of my three technical indicators are bearish both the July and November soybean futures. Looking at the weekly continuation chart I can make the case that we should see support another $0.38 lower from where the spot market closed today with additional support $0.88 lower than the current price level. Unless some real weather concerns develop or we are presented with less planted acres than what the USDA is currently projecting this could get ugly.

Wheat:
The wheat market traded sharply lower on continued dismal demand for USA wheat and forecasts for a drier weather pattern for the rain-soaked US southern Plains. Traders are hoping that harvest activity can pick up if weather conditions improve this week and next.
As it stands right now 11% of the winter wheat crop has been harvested. That is up from 4% last week but still trails the five year average of 20%. Crop conditions remain pretty good with winter wheat unchanged at 43% good to excellent while spring wheat improved 1% for the week to come in at 70% good to excellent. The bottom line is that the USA remains uncompetitive in the world market as borne out by today’s weekly export inspections of a mere 13.9 million bushels, towards the low end of trade expectations.
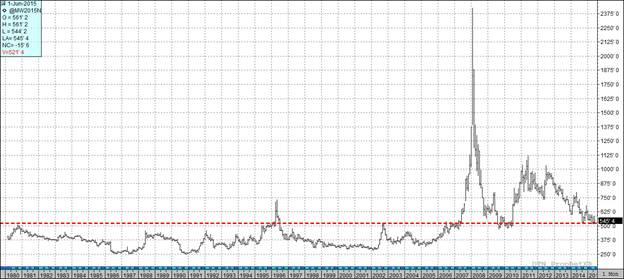
All three of my technical indicators are bearish both the Minneapolis and Kansas City September futures. I was going through and looking at charts I have referenced here in the past. I was struck by the fact that the monthly Minneapolis spot futures chart is up against an area I had previously identified as a support level. We will have to see if this area holds or not. If this level gives way you could make the case that we could drop another $0.60 or so.

Top Trending Reads:
- S.D. farmboy turned investment banker creates farm management program
- Farm Software: 5 Tools Every Farmer Should Be Using
- How To Determine If Commodity Prices Are Too Low To Market Grain
- Using Futures Options In Grain Marketing

Top Trending Reads:


