Craig’s Closing Comments
Craig Haugaard
June 29, 2015
In a land noted for its jackalope population it seemed logical that we should also create a creature for those times when traders are uncertain as to which direction the market is moving. With that in mind I introduce to you the Bullbear. With the market recently having had a very nice run up in price but with the trade also experiencing a certain level of fear and uncertainty heading into tomorrow’s report this seemed like a good time to introduce him.

Corn:
We had some additional jockeying ahead of tomorrow’s USDA report. Heading into the report the average trade guess is that we will see the USDA’s stocks pegged at 4.555 billion bushels while planted acres are expected to be at 89.29 million acres.
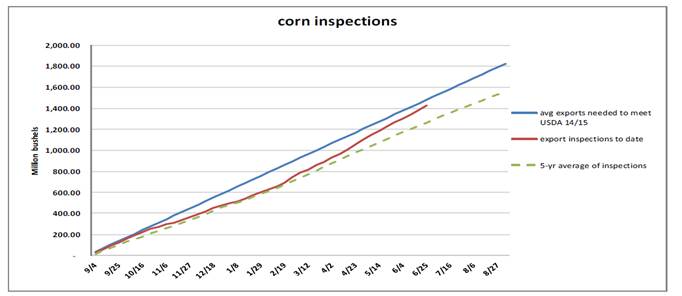
We had the weekly export inspections report out this morning and at almost 41 million bushels it was above the top end of trade guesses. As you can see on the following chart, we have been closing the gap between what we need to export to hit the USDA number and what we have been exporting for the past few months. At this pace it looks like we may end up hitting or exceeding the USDA projection.

After the close we had the weekly crop conditions report. The trade was looking for conditions to slip a couple of points and were not disappointed as we saw the percent rated good to excellent slip from 71% last week to 68% this week. A year ago at this point 75% of the crop was rated good to excellent.
It will be interesting to see how this year plays out. I have been looking at other years to see if it can give some insight into this year. The year 2010 gave us the 2nd wettest May, June, July in history for the states in Illinois and Iowa. In fact the May/June rainfalls this year have been nearly spot on what we had in those two months in Illinois in 2010. That year Illinois had a record yield on beans, a record that was just beaten last year.
The corn yield in 2010 was 157 bushels per acre. The 10 year corn average yield from 2004 to 2014 was 165 bu/acre. In Iowa that year the corn yield of 165 bu/acre was down from the five year average while the bean yield stayed right in line with the 2009 and 2011yields.
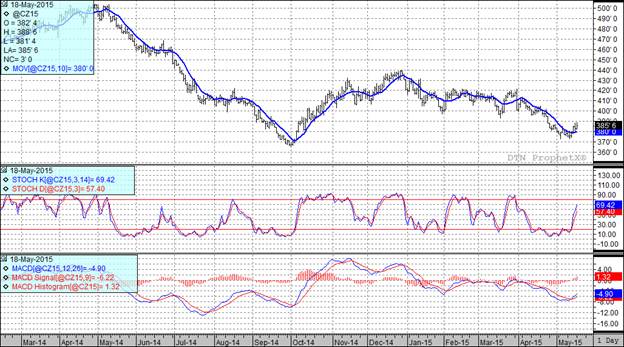
At the present time all three of my technical indicators are bullish both the July and December corn futures.

Soybean:
This continues to be a weather market and with forecasts continuing to look wet for eastern and southern growing regions it would appear that the bean market will most likely remain at the mercy of daily weather patterns. It could be a real roller coaster for a while yet.
Heading into tomorrow’s report the expectations for tomorrow’s are that stocks will come in around 670 million bushels and the planted acreage is expected to come in around 85.171 million acres. I find that number interesting since the March USDA projection was 84.8 million acres. So, in spite of the well documented planting problems the trade is looking for a slight increase in acres over the March report.
The crop planting progress and conditions report this afternoon showed that soybeans are now 94% planted versus the five year average of 97% planted. Missouri continues to be the place of greatest concern with only 62% of the crop planted versus the five year average of 94%. The crop rating dropped a couple of points to stand at 63% good to excellent, down 2% from last week as well as being done from the 72% good to excellent we enjoyed at this point a year ago.
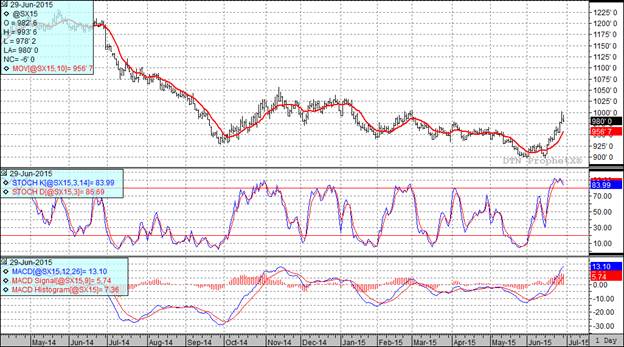
At the present time two of my three technical indicators are bullish both the July and November soybean futures.

Wheat:
Wheat remains a weather market as well. We have rain raising havoc with the winter wheat crop in this country while in the Northwestern USA, Canada and EU we have some real concerns with ongoing dryness.
Speaking of winter wheat harvest it is now 38% complete versus 19% harvested last week. The five year average is for 46% of the winter wheat crop to be harvested by this point. Crop conditions were unchanged with 41% of the winter wheat crop still rated as good to excellent. A year ago at this point only 30% of the crop fell into that category
Spring wheat crop conditions improved by 1% to 72% good to excellent. A year ago 70% of the crop was rated good to excellent on this date.
As we head into tomorrow’s report the average trade guess for June 1st wheat stocks is 718 million bushels and all wheat acreage estimate is 55.87 million acres.
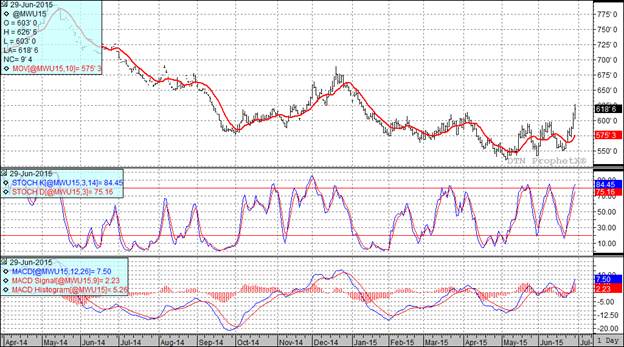
All three of my technical indicators are bullish both the Minneapolis and Kansas City September futures.

Top Trending Reads:
- S.D. farmboy turned investment banker creates farm management program
- Farm Software: 5 Tools Every Farmer Should Be Using
- How To Determine If Commodity Prices Are Too Low To Market Grain
- Using Futures Options In Grain Marketing

Top Trending Reads:


