Craig’s Closing Comments
Craig Haugaard
June 30, 2015
Corn:
Uffda, what a day. The USDA lit a fire under this market and we spent the rest of the session trying to hang on to a runaway.
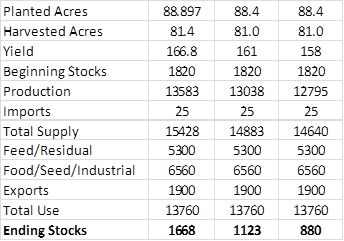
The trade was looking for planed acres to come in at 89.292 million acres so the reported number of 88.897 million was 395,000 acres less than what the trade was looking for. Traders were also expecting the quarterly stock number to come in at 4.555 billion bushels so the actual number of 4.447 billion was seen as supportive to prices. The following table has been adjusted to reflect today’s acreage and stocks number while the next two columns reduce the acres slightly and also illustrate what happens should the projected yield slip from here.
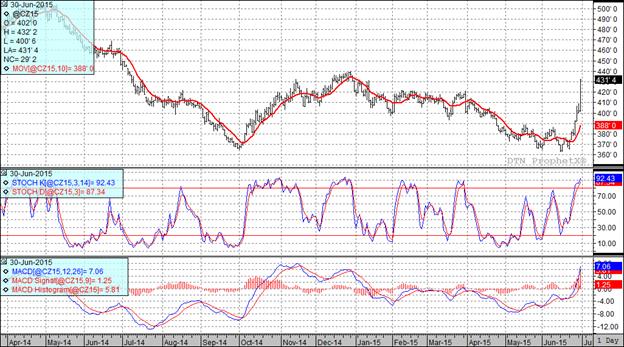
At the present time all three of my technical indicators are bullish both the September and December corn futures.
Soybean:
I was kind of fascinated to see how the market reacted to today’s report. Let’s start with the plated acres. In spite of all the talk about prevent plant acres the conventional wisdom was that this report would show larger planted acres than the March number of 84.635 million acres. As we headed into today’s report the average trade guess was that we would see it come out at 85.171 million acres so the actual number of 85.139 million acres was only 32,000 acres less than the average trade guess. One could argue that this was friendly but not enough to generate an increase in excess of fifty cents. Now, as Paul Harvey used to say, the rest of the story. In addition to the report today, the USDA announced they will resurvey producers in Kansas, Arkansas and Missouri for soybeans due to weather conditions that delayed plantings. The feeling among traders seems to be that we could still see acres drop by at least two million. Traders are also keeping a sharp eye on the weather where forecasts continue to have rain chances for eastern and southern growing regions in the coming days. With this report now out of the way weather should once again take center stage.
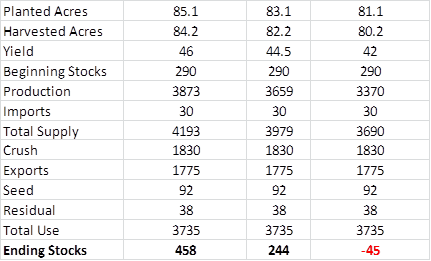
Planted acres were not the only report out today, we also had the quarterly stocks report. In today’s report quarterly stocks for soybeans as of June 1st came in at 625 million bushels, less than the estimated 670 million bushels the market was looking for. I suspect that this helped fuel the rally today nearly as much as the acres report. So, where do we go from here? On the following chart I have taken today’s acres and plugged them in as well as adjusting the carry-in to reflect today’s quarterly stocks number. In the left hand column I left the rest of the USDA’s numbers unchanged while in the following two columns I reduced the planted acres by two million in each column as well as reducing the national average yield to reflect the tougher growing conditions. We have a long way to go yet this year but if the resurvey of producers results in a downward revision of acres and we continue to see the crop conditions continue to slip we could have another round of fireworks.
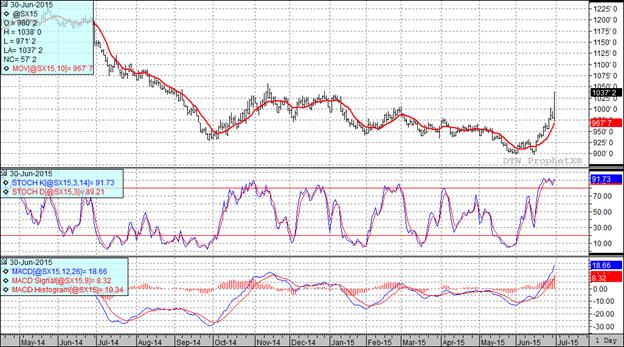
At the present time all three of my technical indicators are bullish both the September and November soybean futures.
Wheat:
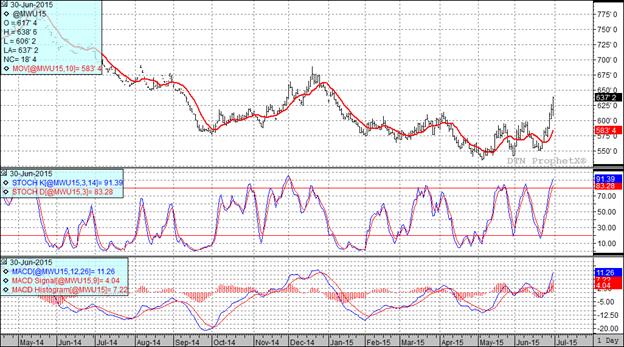
Looking at the wheat today I was taken back to my high school days and the radio was playing, “Ride, ride, ride, hitchin' a ride” I will send a NCFE cap to the first person to email me and tell me the name of that song and artist. Anyway, wheat really was an oddball deal today. The average trade guess for acres was 55.867 million planted acres so today’s actual number of 56.079 million acres certainly exceeded that. The trade was also looking for the June 1st quarterly stocks number to come in at 718 million bushels. The actual number of 753 million bushels was actually above the top end of the range of trade guesses.
The USDA wasn’t the only game in town when it came to wheat news today. We also had the StatsCanada report out today which placed wheat planted acres at 24.1 million acres. That is up from 23.8 million acres planted last year. While we are up from last year the trade was looking for this year’s acres to come in at 24.6 million acres so this report was slightly supportive.
All three of my technical indicators are bullish both the Minneapolis and Kansas City September futures.
Top Trending Reads:
- S.D. farmboy turned investment banker creates farm management program
- Farm Software: 5 Tools Every Farmer Should Be Using
- How To Determine If Commodity Prices Are Too Low To Market Grain
- Using Futures Options In Grain Marketing

Top Trending Reads:


