Craig's Closing Comments
Craig Haugaard
July 15, 2015
Tonight’s comments were composed by Abbey Kittelson, a summer intern from Lake Area Tech.
Reading the news today I started channeling the Doobie Brothers. As I read the US Coast Guard due to high waters they were closing a 50-mile stretch of the Illinois River, the voices in my head were singing “Old black water, keep on rollin.”
Corn:
Weekly ethanol production numbers came out today for the week ending July 10. Total production added up to 6.888 million barrels for the week, averaging 984 thousand barrels/day. These numbers were .30% down from the previous week, but still 4.35% higher than last year. About 103.32 million bushels of corn were used in last week’s production. To meet the USDA estimate of 5.175 billion bushels, corn use must average 97.04 million bushels/week for the remainder of the crop year.
Radar today showed that rain moved across the part of the US that doesn’t need it – Nebraska, Kansas, Iowa and Northern Missouri. However, the next couple of weeks is looking to be warmer than average and lower precipitation.
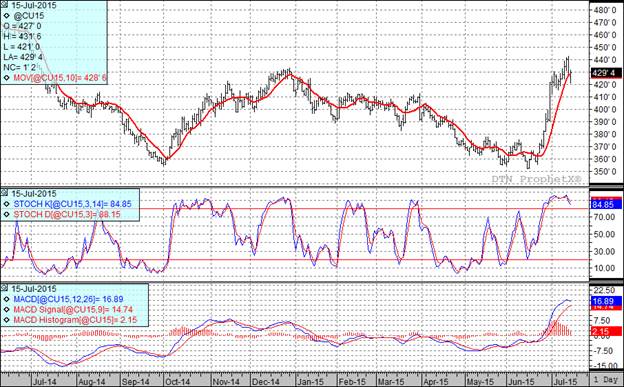
At the present time two of my three technical indicators are bearish both the September and December corn futures.

Soybean:
One of the biggest stories right now that affects beans is China’s falling stock market, which finished down 3.5%. There are also reports that China’s hog numbers are down, and they are currently importing soybeans from South America which could last them a while. China is, by far, our largest customer when it comes to soybean sales and their lack of buying could greatly affect our market.
In contrast, bulls continue talking about the poor US crop and how that can affect soybean carryout for the year. This type of news can offer some much-needed support to the market.
The NOPA crush numbers came out today. June crush was at 142.5, up from last year which was 118.7, and May which was 148.4. Soymeal exports in June were 596 tst, versus 388 last year at this time, and 551 in May.
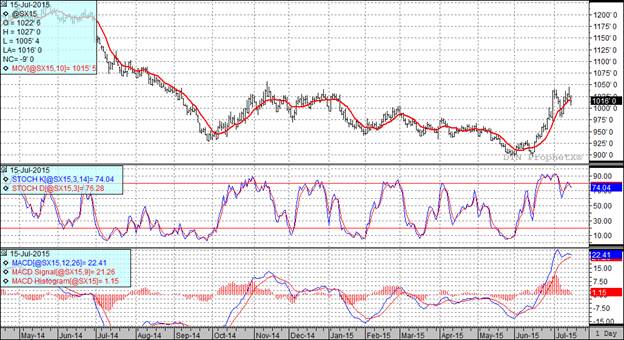
In spite of a softer close today two of my three technical indicators are still bullish both the September and November soybean futures.

Wheat:
Prices continue to fall due to talk of higher yields in US HRW, Europe & Russia this harvest, along with better weather worldwide. European and Black Sea prices are also drifting lower, which is rumored to be because of the Russian and Ukrainian supplies – both might be larger than expected and cutting into demand.
The USDA has raised their ending world stocks estimates for both 2014/15 and 2015/16. This year’s estimates have gone up from 200 mmt to 212, and next year’s from 202 to 220 mmt.
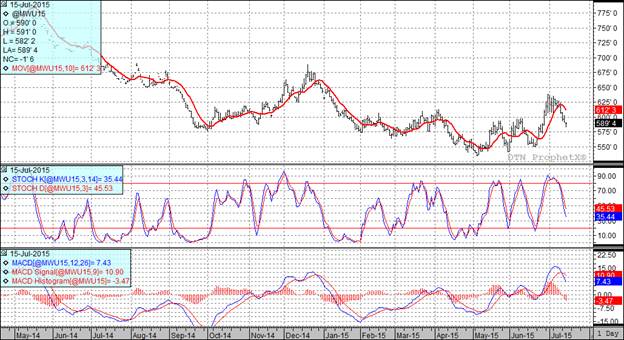
At the present time all three of my technical indicators are now bearish both the Minneapolis and Kansas City September futures.

Top Trending Reads:
- S.D. farmboy turned investment banker creates farm management program
- Farm Software: 5 Tools Every Farmer Should Be Using
- How To Determine If Commodity Prices Are Too Low To Market Grain
- Using Futures Options In Grain Marketing

Top Trending Reads:


