Craig's Closing Comments
Craig Haugaard
July 21st, 2015
Corn:
I want to follow up a little bit on yesterday’s crop conditions report and put a little historical perspective on it. As we all know, we have very distinct differences between the western Corn Belt and the eastern Corn Belt this year. While the western Corn Belt looks to have extremely good crops that is not the case out east. As I reported yesterday, the crop in Illinois is 55% good to excellent. What I failed to mention is that this makes it the second worst crop for mid-July in the past decade. The story is much the same in Indiana where we have the second worst rated corn crop in the past thirteen years and in Ohio where the crop is the second worst rated crop in the past eight years. All of this would seem to argue for a lower national corn yield than the 166.8 bu/acre that the USDA is currently using. In fact, earlier today private analyst, Dr. Cordonnier, pegged the national average yield at 163 bu/acre. That seems a touch high to me but if we accept that number and plug it into the most recent USDA Supply and Demand sheet we get the following result:
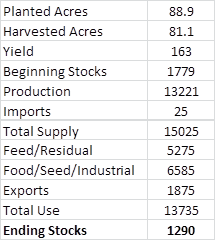
While our Supply & Demand table is certainly tightening it must be noted that South American corn still pencils into the southeast feed market. The USDA is projecting that we will import 25 million bushels this year but some analysts who are looking at the ability of South American corn to work into this country are suggesting that we could end up importing as much as 100 million bushels. We will want to keep an eye on this story and see how this situation develops.
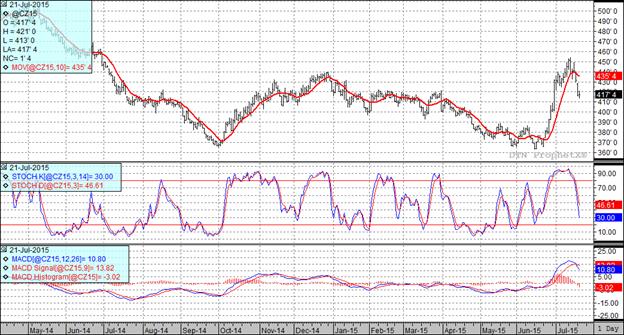
At the present time all three of my technical indicators are bearish both the September and December corn futures. We blew through the first level of support today but should find additional areas of support in the December futures at $4.08 ½ and $3.97 ¾. It is also worth noting that today’s action left a gap in the December futures at $4.29 ¼. I would expect the market to try and fill that gap at some point.
Soybean:
We have much the same weather story in beans as in corn. Beans in the eastern Corn Belt continue to struggle and of course folks are still debating how many acres were lost to prevent plant this year. In Ohio we see a crop that is currently the second worst rated crop in the past eight years while in Indiana they have the second worst crop in the past twenty seven years going for them at this point in the year. If I am not mistaken the fall of 2012 brought us a crop that ended up having a national average yield of 39.8 bu/acre. Nobody is projecting a yield nearly that low but I do see that the aforementioned Dr. Cordonnier is currently pegging the crop at a national average yield of 43.5 bu/acre. If we accept that and leave the remainder of the USDA projections unchanged we get the following Supply & Demand table.
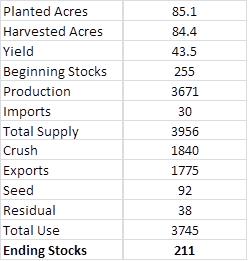
As you can see this scenario leaves us with a projected carryout of 211 million bushels. That is a far cry from the 425 million the USDA is currently projecting and certainly light years from the 500 million bushel number that was bandied about earlier this year.
Of course the other side of the equation is the demand picture and when it comes to demand we in large part live and die with what China does. In June of this year China imported 8.09 MMT of soybeans. The only month in which they have imported more beans was December 2014. The bad news is that most of this business went to South America. Brazil shipped them 6.7 MMT while Argentina shipped 1.2 MMT. We are already seeing new crop sales lag the historic pace with South American getting sales in a time period we usually dominate. It will be interesting to see if our reduced crop pushes the market higher or if the large South American crop can keep prices under pressure.
While we are getting beat a bit in the export market, here in the USA crush demand continues to be very strong. I am being told that crush margins are running in excess of a buck a bushel so I don’t believe that we are going to see plants idle production anytime soon.
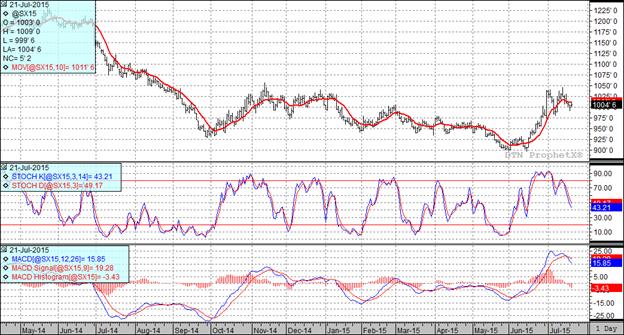
All three of my technical indicators are currently bearish for both the September and November soybean futures.
Wheat:
While corn and soybeans were moving higher today wheat could just not gain any positive traction. One broker I spoke with today told me that he had heard of some elevators getting plugged with old crop bushels as we head into wheat harvest. I can’t speak to that directly but we have certainly seen a great deal of grain move the past few weeks. It is interesting to note that stocks in Duluth/Superior increased by half a million bushels last week to a total of 16.9 million bushels versus stocks of 10.3 million bushels at this point last year.
With spring wheat harvest probably about two weeks away from really getting going we can probably anticipate additional pressure on this market.
In the export world we are still not competitive as we recently saw Egypt buy 175 TMT of wheat from Russia at an average price of $205.37 C&F. Wheat from the USA was not even in the same ballpark but interestingly enough neither was wheat from France or any other exporter for that matter. I know that Russia has been disappointed with their exports lately. In fact, according to SovEcon, Russian wheat exports for July will be about 1.5 MMT versus 3.16 MMT in July 2014. The reduction is due to the new export tax that caused confusion within the Russian export system but they seem determined to overcome that as witnessed by this recent sale.
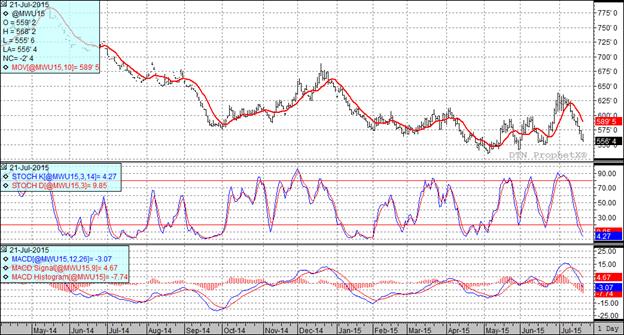
At the present time all three of my technical indicators are bearish both the Minneapolis and Kansas City September futures.
Top Trending Reads:
- S.D. farmboy turned investment banker creates farm management program
- Farm Software: 5 Tools Every Farmer Should Be Using
- How To Determine If Commodity Prices Are Too Low To Market Grain
- Using Futures Options In Grain Marketing

Top Trending Reads:


