Craig's Closing Comments
by Craig Haugaard
August 6, 2015
Corn:
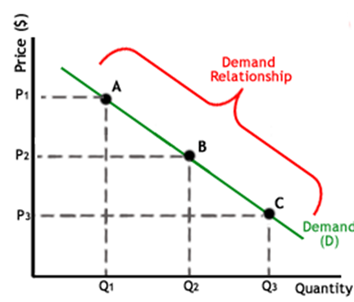
I am having one of those days when my brain seems to be heading down a path that is different from that commonly accepted in polite society as normal. For some reason when I sat down to write the comments tonight all I could think of were the words “supply and demand.” Of course that then had me envisioning fancy economics charts with long treatises about how the drought in the EU could shift the world carry-out from Q3 to Q2 thus raising P3 to P2. It was going to be a thing of beauty but then I remembered having a conversation about this stuff with my slow cousin Jimmy one time when he looked at me and said, “Cwaig, it don’t mean nothing. If you teach a pawwot to say supply and demand and you’ve got an economist.” Come to think of it, he isn’t far off so I will avoid going down that road today.
Corn closed lower for the session as most of the news seemed less than bullish. We kicked off the morning with the weekly export sales and they were very poor. In fact in old crop corn we had net cancellations of 100,000 bushels for the week while in the new crop slot we had sales of 10.9 million bushels. We have four weeks left in the old crop marketing year and with these cancellations now stand at total export commitments of 1.8553 billion bushels with the USDA projecting that annual exports will be 1.85 billion bushels. In other words we need to average roughly 1.325 million bushels of cancelations per week for the remaining four weeks to arrive at the USDA’s projection.
It is not unusual to see export sales slip this time of the year as the Brazilian’s gear up exports as their 2nd corn crop hits the market. That should be the case again this year especially with the Brazilian Real trading at a 13 year low to the USA dollar.
Weather has also been a major player in this market with prices surges on poor weather reports and price pullbacks on good weather reports. Earlier in the week some traders were seemingly concerned about a drier 6 to 10 and 8 to 14 day forecast in the Eastern Corn Belt but those concerns seem to have disappeared today with beneficial rains in Illinois, Indian, and Ohio.
Speaking of weather and the impact that it has on production we did have another analyst take a shot at projecting the national average yield today. In this case it was the Linn Group and they came up with an estimate of 160.4 bu/acre. If we accept that and leave the USDA’s demand numbers unchanged this would project a carry-out of 1.079 billion bushels and would also guarantee that prices would be “muy mucho mas alto” as they say in California.
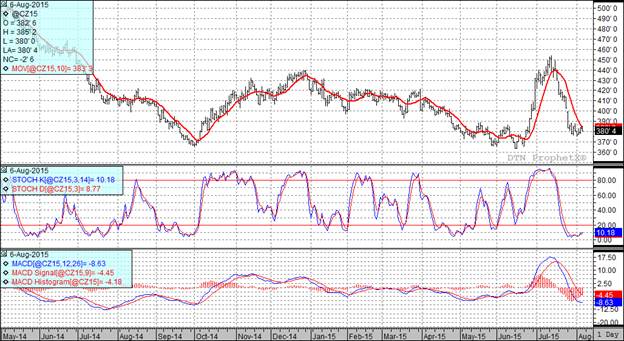
At the present time two of my three technical indicators are bearish both the September and December corn futures.
Soybean:
The weekly export sales report was ugly. For the week of 7/30/15 exports sales were announced at a net cancellation of 16.44 million bushels. While that was downright depressing we can take solace in the fact that with a mere four weeks left in the marketing year we will need to average weekly net cancellations of 7.15 million bushels per week to slip back to the number the USDA has been projecting. Speaking of exports we did have an announcement from the USDA this morning that 132 TMT of soybeans for 2015/16 had been sold to China. At the same time we are hearing that China also bought some additional cargos of beans from Brazil recently as well.
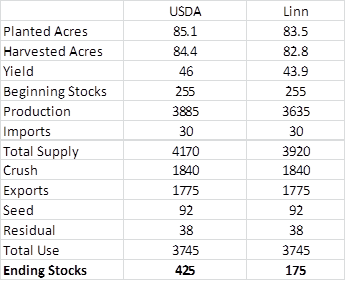
We did have the Linn group out with their yield projections today. For soybeans they are pegging the national average yield at 43.9 bu/acre and they are also seeing 1.6 million fewer harvested acres than what the USDA reflected in the July report. The following table compares the July USDA report with today’s Linn numbers. I have used the Linn acreage and yield numbers while leaving the remainder of the USDA’s numbers in place. You can determine for yourself what you think prices will do if the Linn folks are correct.
Finally, we are seeing increased talk about an El Nino event in the coming months. The last El Nino we had was in 2009/10 and was considered a moderate El Nino. That event resulted in an above trend-line soybean yield in Brazil. The impact of El Nino weather patterns on crops in Brazil tends to be more moderate because of the abundant rains Brazil typically gets during their rainy season. We have a long way to go to even get that crop in the ground but I suppose it is never too early to gin up a weather story.
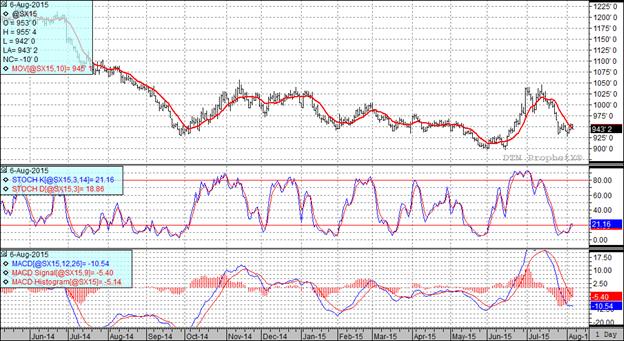
In spite of today’s slump two of my three technical indicators remain bullish the September while two of three are now bearish the November futures.
Wheat:
When my sister was in high school this rather obese young man asked her to go to a dance with him. She said she would and my mom was really stressing to her that she needed to be nice to him and find something to compliment the guy on. As the evening wore on she was really wracking her brain trying to come up with a compliment when finally it hit her. She turned to her date and said, “You know, for a fat guy you sure don’t sweat very much.” I kind of find myself in that position when it comes to wheat. I was at the Faulkton crop tour today and had a few folks remind me that I needed to put a little more effort into my wheat comments. Seems that I kind of peter out after corn and beans and I was also encouraged to find something nice to say about the price prospects. Here is my attempt.
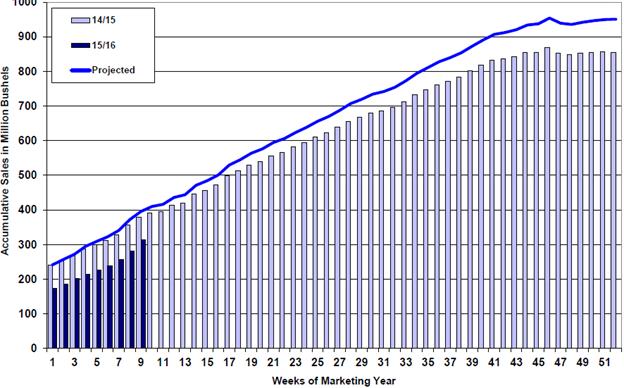
We had a very solid weekly export number today; in fact, at 30.8 million bushels I believe it was the best week of the marketing year thus far. Of course, because I have a hard time saying anything good about wheat I am going to toss some cold water on my previous statements with the following chart which indicates that we are still lagging where we need to be.
The Russian ruble slumped to its lowest value versus the dollar in the last six months so that will probably encourage additional business heading to Russia. Elsewhere in the FSU we had the Ukraine agricultural minister state earlier this week that they would export 36 MMT of grain in 2015/2016. Today the Ukrainian Agrarian Assn estimated they could export up to 40 MMT.
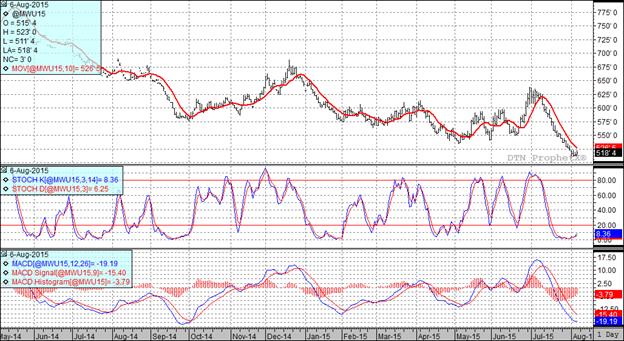
This market has been very oversold with the funds holding large short positions. We did see the funds buy 5,000 contracts today and we could see additional short covering which would provide us with a short term corrective bounce.
At the present time two of my three technical indicators are bearish both the Minneapolis and Kansas City September futures.
Top Trending Reads:
Topics: Grain Markets
%MCEPASTEBIN%


